Daily Crypto Signals: Bitcoin Holds Above $105K, XRP Risks Sharp Decline Amid Mixed Institutional Signals
Bitcoin maintains stability above $105,000 despite supply squeeze warnings from Sygnum Bank, while XRP faces potential 22-38% correction
Quick overview
- Bitcoin remains stable above $105,000 despite warnings of a supply squeeze from Sygnum Bank.
- XRP is facing a potential correction of 22-38% due to institutional outflows and bearish technical patterns.
- JPMorgan has become the first major U.S. bank to accept crypto ETFs as loan collateral, indicating increased institutional acceptance of digital assets.
- Ethereum shows strong performance with significant inflows, suggesting a shift in institutional interest away from Bitcoin.
Bitcoin maintains stability above $105,000 despite supply squeeze warnings from Sygnum Bank, while XRP faces potential 22-38% correction amid institutional outflows and bearish technical patterns, as JPMorgan becomes first major U.S. bank to accept crypto ETFs as loan collateral.
Crypto Market Developments
In June 2025, the cryptocurrency market saw a lot of institutional acceptance, but there was also a lot of technical uncertainty. JPMorgan made news when it became the first major U.S. bank to accept crypto ETFs as loan collateral. The first one was BlackRock’s iShares Bitcoin Trust, which has $70.1 billion in assets. This turning point shows that traditional banks are more open to digital assets.
Institutional feelings are still varied. Bitcoin ETFs saw three days in a row of outflows totaling $1.23 billion, ending a 10-day streak. Ethereum ETFs, on the other hand, had 12 days in a row of inflows with $321 million in weekly flows. This difference shows that institutions’ tastes in the crypto markets are changing.
Options trading raises worries about market volatility. For example, $300,000 Bitcoin call options have more than $600 million in notional open interest, even though Bitcoin is selling at just $104,000. The excessive positioning, with call options trading at a 10% premium to puts, is like what happened before Bitcoin’s 50% drop from $64,000 in April 2021.
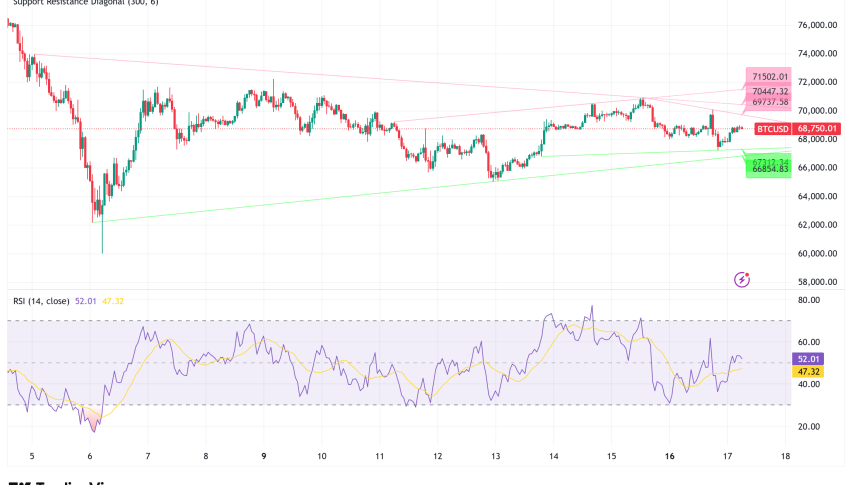
Bitcoin Holds Above $105,000
Bitcoin BTC/USD is trading close to $105,000, which is 6.1% lower than its all-time high of $105,000 on May 22. It is at important technical levels. Long-term holders are still confident, as the Net Position Realized Cap has crossed $20 billion. This shows that investors who have held Bitcoin for more than 155 days are still buying it.
Sygnum Bank said that a supply squeeze is coming that might cause a lot of volatility. Bitcoin’s liquid supply shrank by 30% over 18 months as more institutions started using it and ETFs bought up more of it. Since the end of 2023, exchange balances have dropped by over 1 million BTC. In just two days, big platforms saw more than 20,000 BTC leave.
As sovereign interest grows, supply tightens. Three states in the U.S. have established laws about Bitcoin reserves. New Hampshire has signed the bills into law, and Texas is set to do the same. The governments of Pakistan and Reform UK declared plans to look into Bitcoin reserves throughout the world.
Bitcoin is having a hard time approaching the $105,347 twenty-day moving average, according to technical analysis. Bears want to reach the important $100,000 level, while bulls need to break through the $106,800 level to get to the $109,588-$111,980 resistance zone. If Bitcoin does well there, it could go up to $130,000, but if it doesn’t, it could go down to $100,000 support.
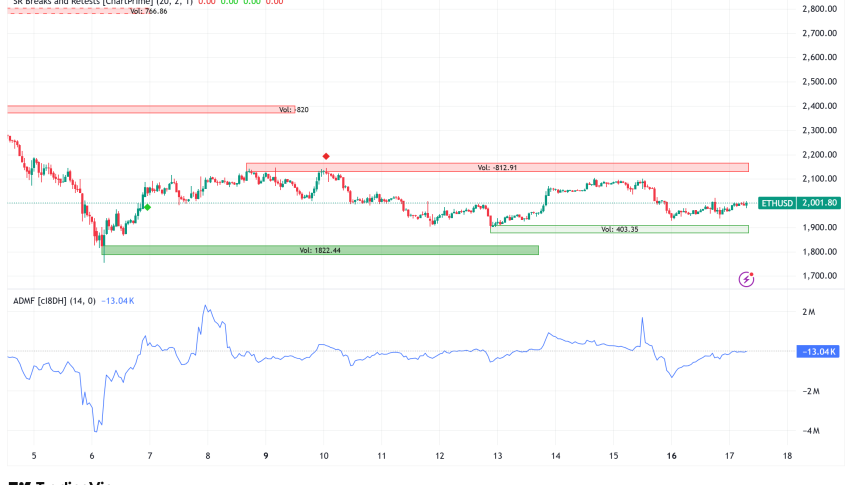
Ethereum’s $2,600 Support Holds
Ethereum ETH/USD is quite strong, rising 46% in a month to $2,630, which is much better than Bitcoin’s 16.5% rise. The ETH/BTC ratio went up 30% per month, regaining 48% from April’s multi-year low. This suggests that institutions are moving toward Ethereum.
Spot Ethereum ETFs saw 12 days in a row of inflows, while Bitcoin ETFs saw withdrawals. This shows that institutional investors are becoming more confident. CoinShares data shows that Ethereum investment products brought in $321 million a week, the most money since December 2024.
Technical analysis backs up the positive trend. Ethereum is very close to breaking out above the $2,680-$2,850 resistance zone, which is where the 200-day moving average lies. If the market breaks through, it might rise to $4,000 and could even break new yearly highs.
Analysts see similarities to Ethereum’s structure from 2016 to 2017 and think that if the patterns continue, the price might reach $6,000. The monthly chart reveals that Ethereum is using $2,500 as support, just like it did in 2021 when it retested the level and then saw big price increases.
The ETH/BTC pair is trading between 0.022 and 0.026, and if it breaks out, it might make other altcoins stronger. Some analysts think that cup-and-handle patterns might lead to 55% rallies, which could signify the start of a new altseason.
XRP Faces Bearish Pressure
XRP XRP/USD is under a lot of pressure to go down, even though it has recovered 40% from its April lows and is now trading around $2.21. It is still 37% below its January top of $3.40. A lot of signs point to a big correction risk in the future.
The Net Unrealized Profit/Loss statistic for XRP entered the “Belief-Denial” phase, which has traditionally been when local tops happen. This attitude zone usually leads to distribution because holders aren’t sure what to do when prices are volatile, which is similar to what happened in 2021 when XRP dropped from $2 levels.
It seems that institutions are losing interest. XRP exchange-traded products saw $28.20 million in withdrawals each week, for a total of $56.60 million in outflows each month. Ethereum ($321.40 million), Solana ($1.5 million), and Sui ($2.2 million) all had a lot more money coming in than this.
Technical analysis shows that XRP is stuck in a falling wedge pattern. Recent pullbacks from upper trendlines caused significant declines, such the 45% drop in March. The setup makes it more likely that the price will drop to $1.78 (22% drop), which is in line with the wedge’s lower trendline and 50-week moving average.
The worst-case scenarios say that the wedge’s top might drop to $1.45 (38% correction). But falling wedges usually end up being bullish. If there are clear breakouts over the upper trendlines, measured advances might hit $3.66. However, it’s hard to say when this will happen because institutional flows are getting worse and indicators are overbought.
- Check out our free forex signals
- Follow the top economic events on FX Leaders economic calendar
- Trade better, discover more Forex Trading Strategies
- Open a FREE Trading Account
- Read our latest reviews on: Avatrade, Exness, HFM and XM