KAP Ltd Rises 20% Off June Lows Despite 30% EPS Slump Forecast for FY25
KAP Limited (JSE: KAP) edged 0.51% higher to 199 ZAC on Monday, extending a sharp 20% rebound from June’s low of 165 ZAC.
Quick overview
- KAP Limited's shares rose 0.51% to 199 ZAC, marking a 20% recovery from June's low of 165 ZAC.
- Management forecasts a minimum 30% decline in earnings per share for the year ending June 2025, reflecting operational challenges.
- Technical indicators suggest KAP shares are testing key resistance levels, with potential targets of 214-225 ZAC if a breakout occurs.
- External pressures, including rising producer inflation and political uncertainty, continue to impact KAP's financial outlook.
KAP Limited (JSE: KAP) edged 0.51% higher to 199 ZAC on Monday, extending a sharp 20% rebound from June’s low of 165 ZAC. This price resilience comes despite management forecasting a minimum 30% drop in earnings per share (EPS) for the full year ending June 2025. EPS is projected to fall by at least 13.1 cents from 43.8 cents last year, while headline earnings per share (HEPS) may decline by more than 13.6 cents from 45.3 cents.
The warning reflects operational and structural headwinds, including:
- Margin pressure from the R2 billion MDF production ramp-up
- Sluggish vehicle production impacting Feltex
- Underperformance at Unitrans amid ongoing restructuring
Although revenue from Safripol and PG Bison remains stable, EBITDA compression and weaker operating margins remain in focus.
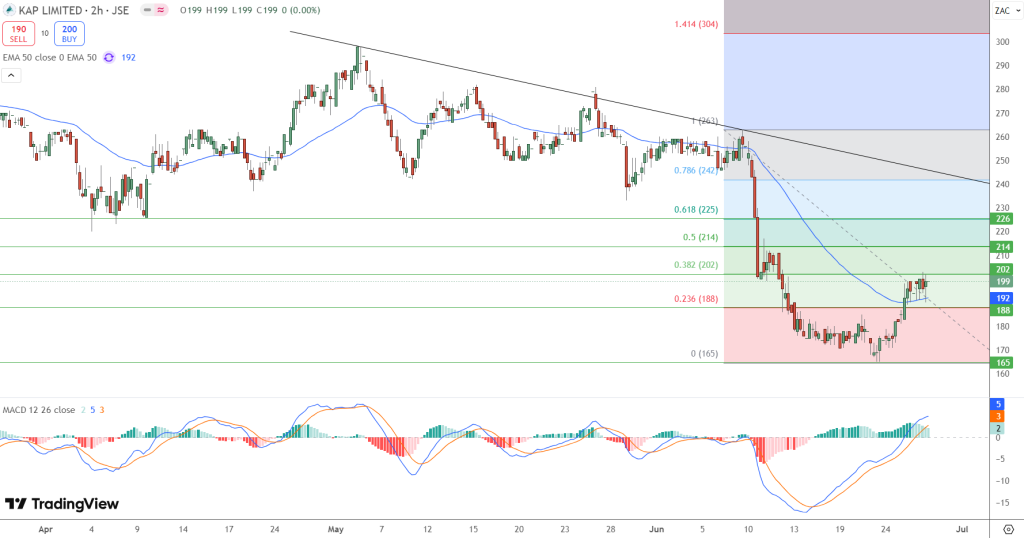
KAP Shares Technical Setup Eyes 202–214 Resistance
Technically, KAP shares have climbed steadily since bottoming out at 165 ZAC, now hovering just below the key 202 resistance zone. Price recently broke above the 50-period EMA at 192 and is now testing the 0.382 Fibonacci retracement level at 202.
Momentum indicators remain supportive:
- MACD histogram and signal lines trend positively
- 0.5 Fibonacci level sits at 214, a critical mid-term barrier
- 0.618 Fib resistance awaits at 225, aligned with prior volume congestion
Failure to close above 202 could lead to a pullback toward 192 or 188. However, a decisive breakout would validate the recovery and potentially target 214–225 in the short term.
Debt Relief, Inflation, and Macro Pressures
Externally, South Africa’s producer inflation rose to 0.7% year-on-year in May, tightening cost conditions for industrial firms. While the rand showed mild strength, political uncertainty, delayed fiscal reform, and global tariff noise continue to weigh on sentiment.
KAP’s R1.6 billion debt refinancing has helped stabilize its capital structure, though weak EBITDA has delayed material progress on reducing net leverage.
- Check out our free forex signals
- Follow the top economic events on FX Leaders economic calendar
- Trade better, discover more Forex Trading Strategies
- Open a FREE Trading Account
- Read our latest reviews on: Avatrade, Exness, HFM and XM
Related Articles


Sidebar rates
Related Posts
