btc-usd
Forex Signals Brief July 1: EZ June CPI Inflation and US ISM Manufacturing on Agenda
Markets are watching closely as Eurozone inflation and US manufacturing data set the tone for policy expectations today.
•
Last updated: Monday, June 30, 2025

Quick overview
- Markets are closely monitoring Eurozone inflation and US manufacturing data to gauge future policy directions.
- Eurozone inflation is expected to show further cooling, with analysts predicting a drop in core HICP to 2.3% for June.
- In the US, the ISM Manufacturing PMI indicates steady factory growth, but rising input costs due to tariffs are raising inflation concerns.
- Gold prices have reversed sharply, closing below the 50-day SMA, while Bitcoin has bounced back after testing support levels.
Live BTC/USD Chart
BTC/USD

0.0000
MARKETS TREND
Markets are watching closely as Eurozone inflation and US manufacturing data set the tone for policy expectations today.
Today’s Forex Market Events
Eurozone CPI Preview: Signs of Further Cooling
Investors are keenly watching Tuesday’s Eurozone inflation report for confirmation that price pressures are continuing to moderate.
In May, headline annual HICP inflation fell to 1.9% from 2.2%, marking the first drop below the ECB’s target since September 2024. Services inflation slowed sharply to 3.7% from 4.0%, while core inflation retreated to 2.4% from 2.7%.
For June, consensus sees core HICP slipping further to 2.3%, while headline inflation is expected to remain stable around 1.9%. Investec analysts, however, forecast a slightly more pronounced moderation, with headline HICP edging down to 1.8% and core HICP to 2.2%.
Such data would bolster the European Central Bank’s case for maintaining a cautious policy stance while signalling that its rate cuts earlier in 2025 are working to contain price growth.
US ISM Manufacturing PMI: Growth Holds as Costs Rise
Meanwhile, in the US, Tuesday’s ISM Manufacturing PMI will test the resilience of American factory activity amid renewed tariff worries.
June’s flash PMI held steady at 52.0, matching the 15-month high seen in May. S&P Global noted that factory output grew for the first time since February, supported by solid new order flows.
However, manufacturers are scrambling to stockpile inputs amid tariff concerns, leading to the fastest inventory build in over three years. Backlogs of work also expanded for the first time since September 2022, and employment surged at its quickest pace in a year.
But these gains have come at a cost: input and output prices rose at their fastest rates since July 2022, as most firms passed tariff-driven expenses to consumers. The sharp rise in price pressures is likely to keep inflation concerns alive even as factory growth remains steady.
Last week, markets were slower than what we’ve seen in recent months, with gold retreating as a result, the EUR/USD jumping above 1.16 but returned back below 1.15, while stock markets retreated on Friday. The moves weren’t too big though, and we opened 35 trading signals in total, finishing the week with 23 winning signals and 12 losing ones.
Will the 50 Daily SMA Turn Into Resistance for Gold?
Last week was also notable on the commodities front, with gold prices delivering a key technical signal.
After hitting an all-time high near $3,500 per ounce in April, XAU/USD has reversed sharply. On Friday, the metal closed decisively below its 50-day SMA, a level that had offered reliable support for nearly a year.
This breakdown points to waning bullish momentum and opens the door to further declines. While a brief $30 rebound pushed prices back above $2,300, traders are now eyeing the 100-day SMA around $3,150 as the next significant support.
USD/JPY: Resistance Holds Despite Yield Chasing
Currency markets also showed notable moves last week. USD/JPY climbed from 143.40 to 148 early in the week—defying typical interest rate spread logic. Analysts attributed this move more to global yield-chasing flows and capital outflows from Japan than to rate differentials.
However, the pair once again met stiff resistance at the 100-week SMA (green), which has capped gains repeatedly. This rejection suggests that further upside may require a substantial shift in broader risk sentiment.
Immediate resistance remains around 145.00, while key support is seen near 142.70.
USD/JPY – Weekly Chart
Cryptocurrency Update
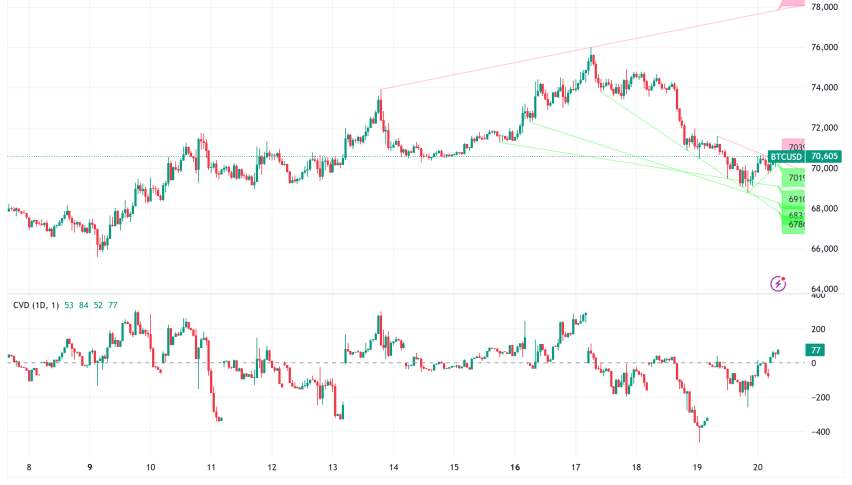
Bitcoin Tests Support Levels Before Bouncing
Bitcoin also faced selling pressure earlier in the week, breaking below its 50-day moving average near $104,000 and then slipping under $100,000 for the first time since early May. However, this dip was quickly seen as a buying opportunity by long-term investors. Buyers stepped in around the 20-week simple moving average (gray), lifting prices by roughly $10,000 to finish the week closer to $108,000, signaling ongoing confidence among committed holders.
BTC/USD – Weekly chart
Ethereum Outpaces Bitcoin Amid Technical Tailwinds
Ethereum (ETH) has outshone Bitcoin in recent weeks, rallying over 20% since April on institutional buying and excitement over the Pectra upgrade. The technical focus is now the 200-day moving average. A breakout above this level could open the path toward $4,000—potentially allowing ETH to outperform BTC through the summer.
ETH/USD – Daily Chart
- Check out our free forex signals
- Follow the top economic events on FX Leaders economic calendar
- Trade better, discover more Forex Trading Strategies
- Open a FREE Trading Account
- Read our latest reviews on: Avatrade, Exness, HFM and XM
ABOUT THE AUTHOR
See More
Skerdian Meta
Lead Analyst
Skerdian Meta Lead Analyst.
Skerdian is a professional Forex trader and a market analyst. He has been actively engaged in market analysis for the past 11 years. Before becoming our head analyst, Skerdian served as a trader and market analyst in Saxo Bank's local branch, Aksioner. Skerdian specialized in experimenting with developing models and hands-on trading. Skerdian has a masters degree in finance and investment.
Related Articles


Sidebar rates
Related Posts
