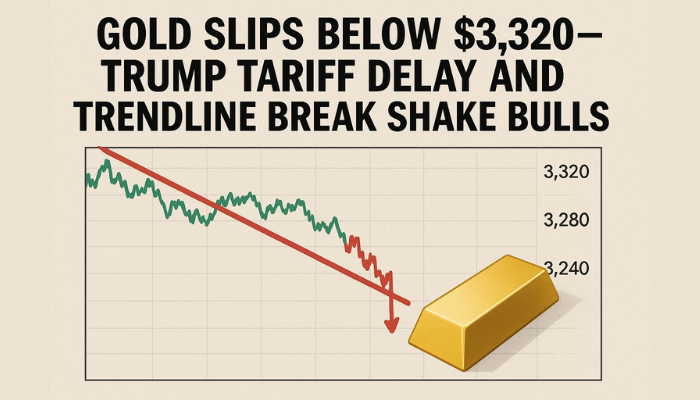
Gold Price Prediction: XAU Holds Above $3,300 but Bearish Signals Emerge
Gold prices show signs of cooling after geopolitical spike, with safe-haven demand easing as Middle East tensions cool and rate-cut bets...

Quick overview
- Gold prices are cooling after a spike driven by geopolitical tensions in the Middle East, as safe-haven demand eases.
- Recent diplomatic efforts and signals from the U.S. have deflated the geopolitical risk premium in gold prices, leading to a loss of momentum.
- Technical indicators show caution, with gold slipping below its critical 50-day Simple Moving Average, raising concerns about potential selling pressure.
- While macroeconomic factors and rate-cut expectations support gold's appeal, the market remains sensitive to any resurgence in geopolitical risks.
Gold prices show signs of cooling after geopolitical spike, with safe-haven demand easing as Middle East tensions cool and rate-cut bets shape outlook.
Shifting Geopolitical Backdrop and Safe-Haven Demand
In recent months, gold (XAU/USD) has commanded the spotlight as a classic safe-haven asset, driven largely by fears of escalating conflict in the Middle East. The Israeli-Iranian standoff and concerns over potential U.S. military strikes on Iranian facilities triggered an aggressive wave of buying that sent gold prices soaring beyond $3,445 an ounce just three weeks ago.
However, diplomatic efforts aimed at avoiding a wider regional war—alongside signals from the United States indicating limited direct engagement—cooled these fears quickly. This change in narrative deflated a significant geopolitical risk premium built into gold prices, causing the initial rally to lose momentum.
Technical Patterns Signal Caution – Daily Chart
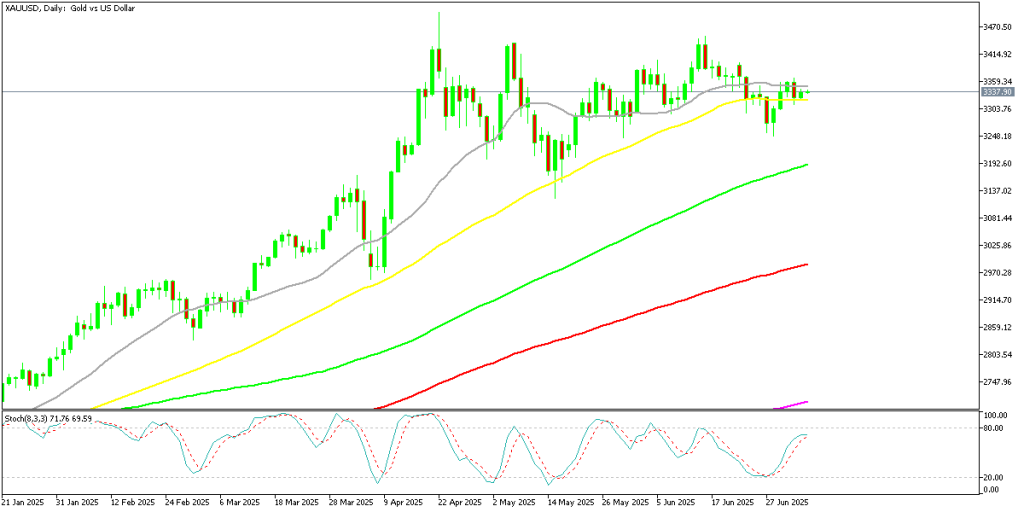
Despite geopolitical easing, GOLD prices remained volatile, recently hovering above $3,100 an ounce. The technical setup has turned more cautious over the last two months, with clear signs of waning buying interest and emerging bearish reversal patterns. Notably, gold slipped below its critical 50-day Simple Moving Average (SMA) last week—a level that had offered strong support since early 2025.
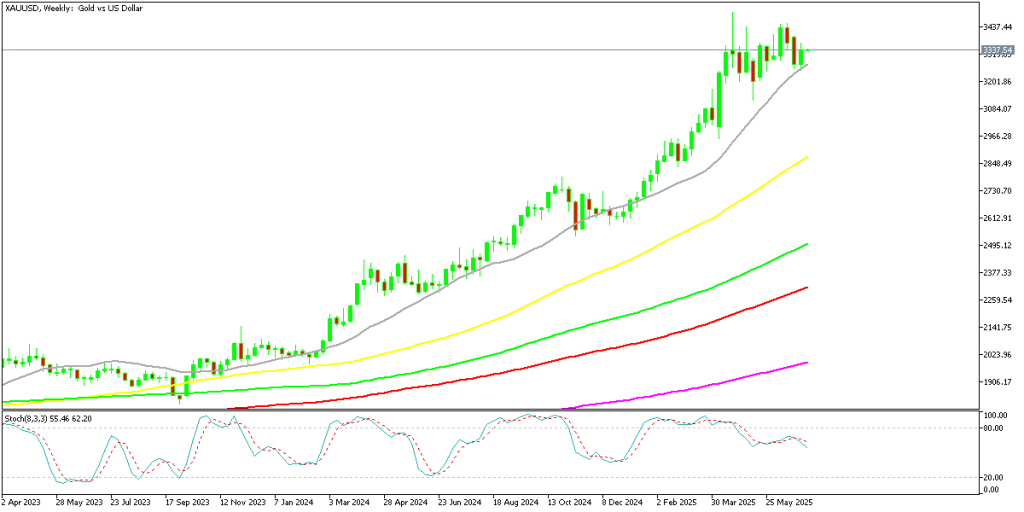
XAU Chart Weekly – Bouncing Off the 20 SMA
Although XAU/USD managed to climb back above the 50 SMA briefly, the failure to regain its upward trajectory underscores the risk of a more meaningful technical break. Traders are now wary that this breach could accelerate selling pressure, especially if no fresh geopolitical catalysts emerge to reignite safe-haven demand.
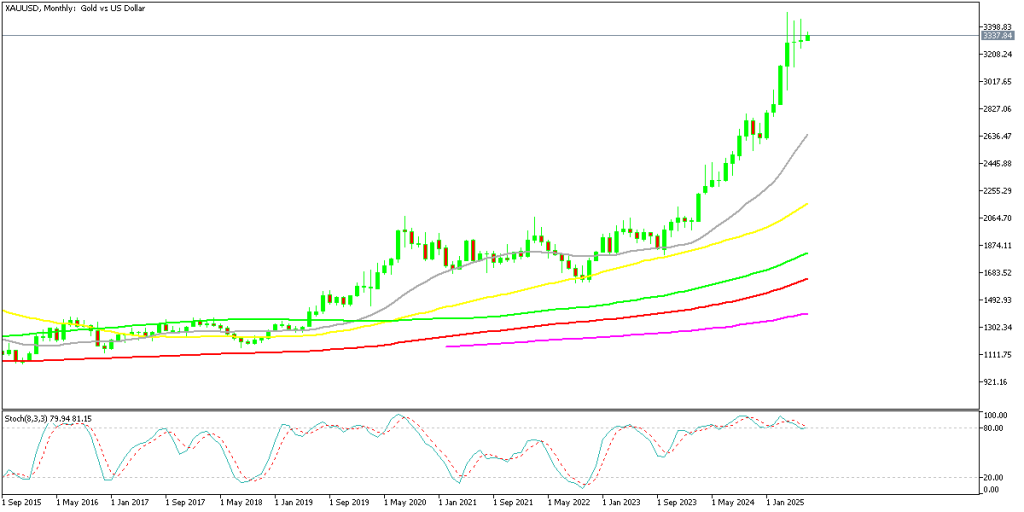
XAU Chart Monthly – Two Dojis Points to A Pullback
Macroeconomic Tailwinds and Rate Expectations
While Middle East tensions have eased, other macro factors continue to shape gold’s outlook. Last week, gold prices did manage to rise nearly 2%, or about $62 an ounce, rebounding off the weekly chart’s 20 SMA as the U.S. dollar weakened. Traders pointed to broader worries about U.S. fiscal sustainability and the risk of trade disruptions as drivers of renewed safe-haven flows.
Monetary policy expectations are also playing a critical role. The CME FedWatch tool now assigns a 91% probability to a rate cut in September, with markets pricing in about 65 basis points of easing by year-end. Lower interest rate expectations are typically bullish for gold, as they reduce the opportunity cost of holding the non-yielding asset.
Political dynamics are feeding this outlook as well. President Trump recently signaled his intention to push rates toward 1% if elected, stating he wouldn’t nominate a Fed chair who opposed further cuts. This policy stance has given traders more confidence in a dovish shift, supporting gold’s appeal despite recent headwinds.
Outlook and Market Sensitivity
While the immediate safe-haven bid has faded alongside easing Middle East tensions, gold markets remain highly sensitive to any resurgence in geopolitical risk. Any renewed escalation could quickly restore demand for the precious metal.
In the short term, however, the loss of momentum, technical break below the 50-day SMA, and the formation of two doji candlesticks on the monthly chart in May and June all suggest that the bullish impulse may be exhausted for now. Some analysts speculate that gold may need to correct modestly—perhaps retreating to around $3,000—before it can mount another sustained move higher.
Traders will be watching upcoming geopolitical developments, U.S. dollar trends, and central bank guidance carefully. Though interest in gold as a hedge remains alive, the market may need a new catalyst to regain its previous buying enthusiasm.
Gold Live Chart
- Check out our free forex signals
- Follow the top economic events on FX Leaders economic calendar
- Trade better, discover more Forex Trading Strategies
- Open a FREE Trading Account