Dogecoin & Shiba Inu Eye 15% Rally as Bullish Data Fuels Trader Optimism
Dogecoin (DOGE) and Shiba Inu (SHIB) are getting attention as both technical indicators and blockchain data show growing bullishness.

Quick overview
- DOGE and SHIB have long-to-short ratios of 1.10 and 1.08, indicating bullish sentiment.
- Large-wallet holders are accumulating both DOGE and SHIB, suggesting increased interest from crypto whales.
- DOGE needs to break the $0.18 resistance level to potentially retest the June 11 high of $0.20.
- SHIB is targeting the 50-day EMA at $0.0000123 to maintain bullish control.
Dogecoin (DOGE) and Shiba Inu (SHIB) are getting attention as both technical indicators and blockchain data show growing bullishness. According to Coinglass, the long-to-short ratio for DOGE is 1.10 and 1.08 for SHIB—numbers above 1 means more longs than shorts. This means market is getting more confident in upwards price action.
Santiment’s Supply Distribution data also shows accumulation among large-wallet holders. Wallets holding 100,000 to 1 million tokens and 1 million to 10 million tokens for both DOGE and SHIB have grown, meaning crypto whales are back in the game.
All this points to a potential breakout if resistance is broken in the next few days.
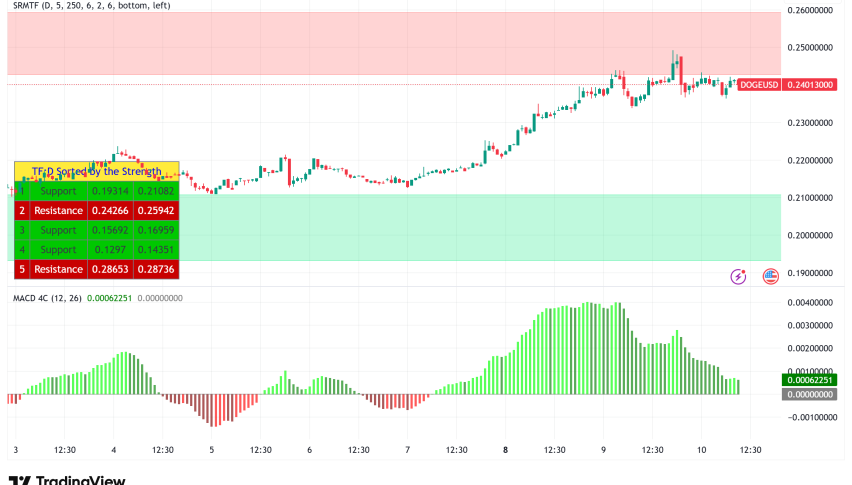
Dogecoin Price Outlook: $0.18 is Key
Dogecoin has bounced back strong, from the descending trendline support at $0.15 last Wednesday. It rallied 9.8% by Sunday and is currently at $0.17. Next level is $0.18. A daily close above this zone could lead to a retest of the June 11 high at $0.20.
DOGE Technical Indicators:
- RSI: 51, slightly above neutral, meaning investors are undecided.
- MACD: Bullish crossover and rising green histogram, momentum is growing.
If price fails to break $0.18, DOGE might go back to $0.15 support.
Shiba Inu Price Outlook: 50-Day EMA is Key
Shiba Inu broke above the descending trendline on June 28 but has been range-bound between $0.0000111 and the 50-day EMA at $0.0000123. Currently at $0.0000118.
Bulls need to close above the 50-day EMA to stay in control. If that happens, it could lead to a move to the June 11 high of $0.0000136.
SHIB Technical Indicators:
- RSI: 49, undecided but hinting at an upside.
- MACD: Bullish crossover and growing green histogram. If price doesn’t break resistance, SHIB might go back to $0.0000111.
Quick Summary:
- DOGE and SHIB have long-to-short ratios (1.10 and 1.08).
- Whales are accumulating per Santiment.
- DOGE needs to break $0.18.
- SHIB targets $0.0000123.
- RSI and MACD are growing but be careful.
- Check out our free forex signals
- Follow the top economic events on FX Leaders economic calendar
- Trade better, discover more Forex Trading Strategies
- Open a FREE Trading Account