Bitcoin Holds $108K as On-Chain Metrics Signal Imminent Rally to $150K
Bitcoin (BTC) is still quite strong, staying above $108,000 as several technical and on-chain indicators point to a parabolic rise coming

Quick overview
- Bitcoin remains strong above $108,000, with indicators suggesting a potential parabolic rise ahead.
- Over 80% of Bitcoin is held by long-term investors, indicating a critical supply shortage that historically precedes significant price increases.
- Institutional involvement is increasing, with large amounts of Bitcoin being moved to institutional-grade addresses, signaling strategic positioning.
- Technical analysis points to a bullish breakout potential, with a target price of $150,000 if key resistance levels are surpassed.
Bitcoin BTC/USD is still quite strong, staying above $108,000 as several technical and on-chain indicators point to a parabolic rise coming soon. Analysts think that the world’s largest cryptocurrency has found a structural bottom between $100,000 and $110,000, even though there has been constant short-selling pressure and market instability.

Critical Supply Shortage Emerges as Diamond Hands Dominate
The most convincing positive indication comes from supply changes that haven’t happened since Bitcoin’s biggest price increases. CrediBull Crypto, a well-known crypto analyst, says that more than 80% of all Bitcoin in existence is currently held by long-term investors. This is a level of supply limitation that has traditionally come before big price changes.
CrediBull said that this proportion was only higher twice in Bitcoin’s 15-year history: when it was at $43,000 and then went up to $73,000, and when it was at $58,000 and then went up to $105,000+. This suggests that the next move might go over $50,000, which could push Bitcoin over $150,000.
Institutional involvement is making this supply concentration even stronger. On Tuesday, more than 19,400 BTC worth about $2.11 billion were moved from inactive wallets to institutional-grade addresses. These coins had been sitting there for three to seven years without being touched. Big moves like this usually mean that traders are setting up their positions, not acting on impulse.
Exchange Outflows Hit 2022 Lows, Confirming Accumulation Phase
According to on-chain statistics from CryptoQuant, the ratio of Bitcoin’s monthly outflows to inflows has decreased to 0.9, the same level it was at the end of the 2022 bear market, when Bitcoin hit its $15,500 bottom. This number, which shows how many currencies are flowing in and out of exchanges, is an important way to monitor mood.
When readings are below 1.0, it means that investors are moving assets off exchanges. This usually means that they are accumulating and have faith in the long run. This reading is similar to the one from December 2022, which came before Bitcoin’s long-term rise from $15,500 to over $100,000 over the course of several months.
BTC/USD Technical Analysis Points to Bullish Breakout
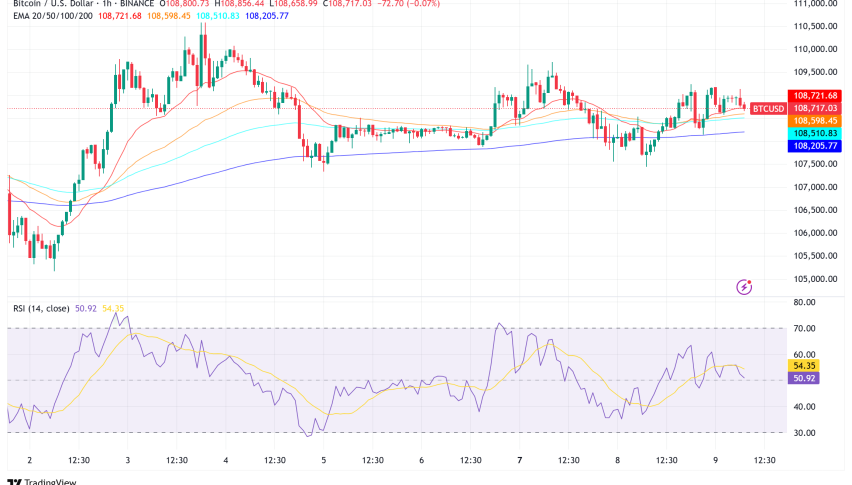
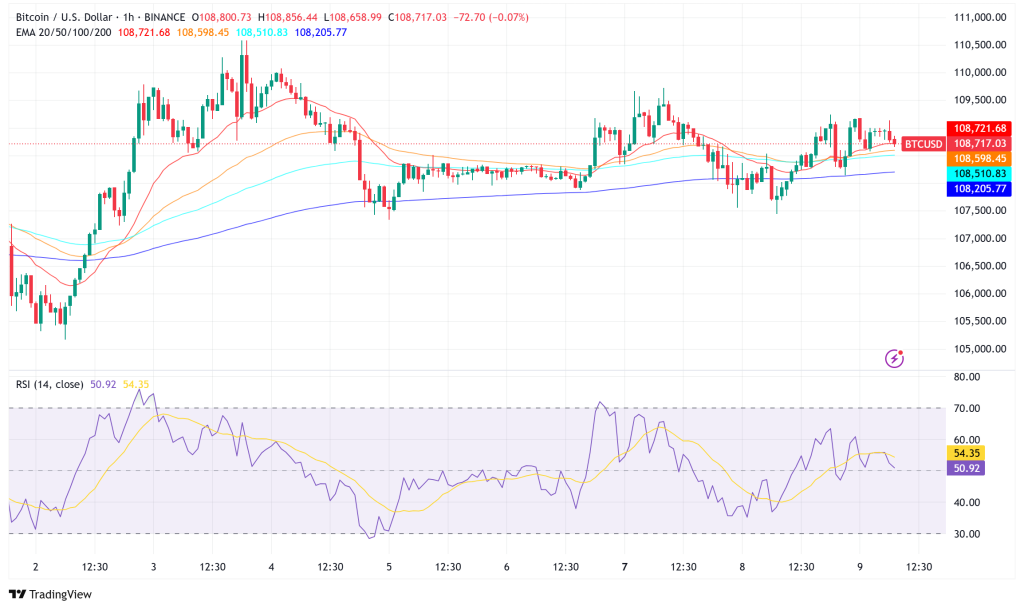
Bitcoin is being squeezed between the 20-day exponential moving average at $107,314 and resistance above it at $110,530 from a technical point of view. The 20-day EMA going higher and the relative strength index (RSI) being in the positive range suggest that the breakout will probably happen to the upside.
If Bitcoin breaks over $110,530, it would test the neckline of an inverted head-and-shoulders pattern and then try to shatter the all-time high of $111,980. If the price breaks above this neckline, it would finish the bullish setup and make it possible for the price to rise toward the pattern target of $150,000.
Analyst Axel Adler Jr. said that Bitcoin’s Bollinger Bands have narrowed to just 7.7% range, which is one of the lowest values during the whole bull cycle. This adds to the technical bullish thesis. Historically, these kinds of volatility compressions come before big directional swings. In a market that is going up, the odds favor an upward breakthrough.
Short Sellers Fail to Break Support Despite Sustained Pressure
Despite 45 days of aggressive selling on Binance derivatives, Bitcoin has stayed in its tight range of $100,000 to $110,000. Cumulative Volume Delta (CVD) data demonstrates that there is a lot of short-selling pressure, but the price hasn’t been able to break lower, which means that robust underlying demand is absorbing this flow.
This pattern of absorption, along with the movements of institutional wallets and the withdrawals from exchanges, makes the case stronger that Bitcoin is creating a structural bottom near $100,000. The steady volume of selling and the lack of a strong reaction to it suggest that big players may be buying strategically.
Bitcoin Price Prediction: $150K Target Comes Into Focus
Analysts are becoming more sure that Bitcoin’s next big move will be up, based on the combination of on-chain data, technical patterns, and supply dynamics. The inverse head-and-shoulders pattern points to a target of $150,000, and the historical trend of supply concentration says that prices might move more than $50,000 from where they are now.
The downside danger is small, with the 50-day simple moving average at $106,642 being a critical support level. If Bitcoin breaks below this level, it might touch $104,500 and maybe even $100,000. However, the overwhelming evidence of accumulation implies that these swings would only last for a short time and could be good buying opportunities.
Market Outlook: Coiled Spring Ready to Release
The market seems to be building up energy as Bitcoin stays firm above $108,000. The record-high supply of long-term holders, the accumulation of institutional investors, the withdrawals from exchanges at multi-year lows, and the technical compression all point to a situation that is similar to Bitcoin’s biggest growth periods.
Even while short-term volatility may continue, the changes in Bitcoin’s supply distribution and the steady absorption of selling pressure imply that the groundwork for the next parabolic move is already in place. Both investors and analysts are keeping a careful eye on what could cause what may be Bitcoin’s biggest gain yet, which could push the cryptocurrency toward the psychologically critical $150,000 level in the next few months.
- Check out our free forex signals
- Follow the top economic events on FX Leaders economic calendar
- Trade better, discover more Forex Trading Strategies
- Open a FREE Trading Account


