btc-usd
Forex Signals Brief July 11: Focus on BTC, UK GDP, Canada Jobs to End the Week
Markets closed with renewed optimism as stocks, commodities, and BTC advanced while today we have the UK GDP and Canadian Employment to...
•
Last updated: Friday, July 11, 2025

Quick overview
- Markets closed positively with stocks, commodities, and Bitcoin advancing, while the UK GDP and Canadian Employment reports are anticipated.
- The US dollar initially surged after strong jobless claims but retreated as yields softened, while commodity currencies gained ground.
- US stock indices reached all-time highs, with the S&P 500 and Nasdaq leading the gains despite new tariff announcements.
- Bitcoin hit a new record high above $115,000, while Ethereum showed strong performance with gains driven by institutional interest.
Live BTC/USD Chart
BTC/USD

MARKETS TREND
Markets closed with renewed optimism as stocks, commodities, and BTC advanced while today we have the UK GDP and Canadian Employment to end the week.
Forex Market Sees Dollar Spike, Then Retreat
Following a stronger-than-expected initial jobless claims report, the US dollar surged sharply and held its gains for around two hours. USD/JPY climbed nearly in lockstep with Treasury yields, while EUR/USD dropped about 50 pips during the move. But this strength proved temporary. As yields softened and sellers reappeared, the dollar reversed course. By the end of the session, the yen had erased the entire intraday move while the euro partially recovered, although it couldn’t close in positive territory for the day after heavy early selling.
Commodity currencies, by contrast, staged a notable turnaround. After early losses, they all finished stronger, supported by improving risk sentiment and a resilient equity market. The Australian dollar, in particular, maintained its post-RBA gains and is now trading near its highest levels of the year, helped by steady bids in global equities and a buoyant risk trade.
Stocks Finish at All-Time Highs
The major US stock indices delivered another strong performance, closing at new record highs in the case of the S&P 500 and Nasdaq. The day saw the small-cap Russell 2000 and the Dow Jones Industrial Average leading gains. The Dow added 192.40 points, or 0.43%, to end at 44,650.70, reflecting optimism that has broadly lifted risk assets in recent weeks. Investors shrugged off tariff headlines and profit-taking fears as market momentum remained firmly positive.
Adding to this backdrop, markets digested news of new US tariffs, including a 50% duty on copper and other items from Brazil set to begin August 1. Despite these potential headwinds, equity markets were firmly higher, indicating that traders continue to bet on robust economic resilience and steady earnings growth.
Markets also kept an eye on upcoming macroeconomic data releases. In the UK, GDP for May is expected to show modest growth of 0.1% month-over-month after a 0.3% contraction in April. Analysts expect this rebound to be driven by recoveries in legal and real estate activity, although risks remain to the downside.
In Canada, uncertainty surrounds the June employment report after the jobless rate hit 7% in May. The labor market has weakened noticeably this year, particularly in trade-sensitive manufacturing sectors in Southern Ontario. Nevertheless, strong consumer spending has supported hiring in services, keeping overall employment growth in positive territory even as trade tensions loom.
Last week, markets were slower than what we’ve seen in recent months, with gold retreating as a result, the EUR/USD jumping above 1.18 but returned back below it, while S&P and Nasdaq retreated yesterday, but Dow Jones kept pushing higher. The moves weren’t too big though, and we opened 35 trading signals in total, finishing the week with 23 winning signals and 12 losing ones.
Gold Sticks to the 50 SMA
Gold prices, meanwhile, remain under technical pressure despite their extraordinary run to around $3,500/oz in April. The metal has slipped below its 50-day moving average, with traders now eyeing the 100-day SMA near $3,150 as the next important support level. Buying activity has been subdued this week, highlighting downside risks in the short term as markets reassess rate expectations and the US dollar’s trajectory.
Yen Slides as Yield Chasing Intensifies
Meanwhile, USD/JPY volatility persisted earlier this week, with the pair surging from 143.40 to 148 as yield differentials and capital outflows from Japan weighed on the yen. However, the rally ran into stiff resistance near its 100-week simple moving average, reinforcing that a sustained breakout may require a more significant shift in investor risk appetite or monetary policy outlook.
USD/JPY – Weekly Chart
Cryptocurrency Update
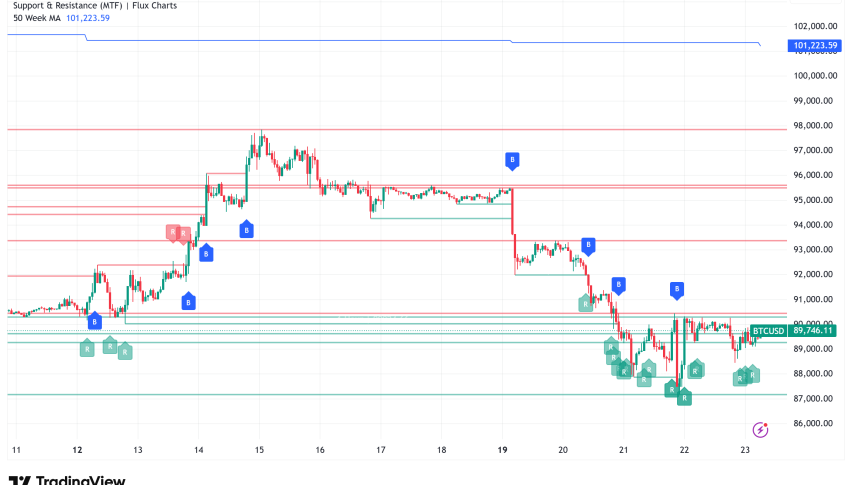
Bitcoin Prints New Record High Above $115K
Bitcoin also stole the spotlight, hitting a new all-time high above $113,000 during the session before backing off slightly. The volatility underscored broader risk appetite in financial markets. Earlier in the week, Bitcoin faced heavy selling pressure, temporarily falling below $100,000 for the first time since early May and breaching its 50-day moving average. However, it swiftly rebounded as long-term investors stepped in around the 20-week simple moving average, sparking a dramatic rally to head above $115,000.
BTC/USD – Weekly chart
Ethereum Breaks Above Resistance
Ethereum has been even more impressive, outperforming Bitcoin in recent weeks with gains exceeding 20% since April. This strength has been driven by renewed institutional interest and anticipation for Ethereum’s upcoming Pectra upgrade, which is expected to further solidify its position in the blockchain ecosystem.
Technically, Ethereum is now testing its 200-day moving average—a critical level for traders. A clear break above this threshold would open the path to the $4,000 zone, enhancing its appeal to investors seeking blockchain exposure.
ETH/USD – Daily Chart
- Check out our free forex signals
- Follow the top economic events on FX Leaders economic calendar
- Trade better, discover more Forex Trading Strategies
- Open a FREE Trading Account
ABOUT THE AUTHOR
See More
Skerdian Meta
Lead Analyst
Skerdian Meta Lead Analyst.
Skerdian is a professional Forex trader and a market analyst. He has been actively engaged in market analysis for the past 11 years. Before becoming our head analyst, Skerdian served as a trader and market analyst in Saxo Bank's local branch, Aksioner. Skerdian specialized in experimenting with developing models and hands-on trading. Skerdian has a masters degree in finance and investment.