Bitcoin Consolidates Above $119K as Analysts Debate $200K Timeline Amid Technical Resistance
Bitcoin (BTC) has stayed strong over the $119,000 mark, gaining 1.6% in the last 24 hours as the top cryptocurrency navigates a complicated
Quick overview
- Bitcoin has maintained a price above $119,000, gaining 1.6% in the last 24 hours, with analysts cautiously optimistic about reaching $200,000 by 2025.
- Concerns about declining trade volume raise questions about the sustainability of the current bull run, as analysts emphasize the need for stable support levels.
- Technical indicators suggest a potential bull pennant formation, with a breakout target of $140,000, although such patterns are only reliable 54% of the time.
- Institutional adoption continues to grow, with significant purchases from companies like MicroStrategy, providing fundamental support for Bitcoin's price trajectory.
Bitcoin BTC/USD has stayed strong over the $119,000 mark, gaining 1.6% in the last 24 hours as the top cryptocurrency navigates a complicated technical terrain. Even though the price is going up, industry analysts are cautiously hopeful that Bitcoin will achieve the widely expected $200,000 target by 2025.
Volume Concerns Challenge Bull Run Sustainability
The main worry for people who watch the market is that trade volume is going down, which could mean that momentum is slowing down even though Bitcoin’s price is still quite high. James Check, the lead analyst at Glassnode, has expressed concerns about the rally’s long-term viability by asking, “How on earth can we be going up when there is no volume?”
Check’s study says that reaching $200,000 by the end of the year would be “a big move” that would almost double Bitcoin’s current market valuation of $2.38 trillion. He says that while it is possible, this kind of thing is “very improbable” without a big rise in trading activity to back up the continuous rise in prices.
The analyst stressed how important it is to set stable support levels. He pointed out that Bitcoin needs to go through several resistance zones at $130,000, $140,000, and $150,000 before it can reach its $200,000 target. Check said, “It’s one thing to get there, but it’s another thing to stay there.” He warned that prices may fall just as quickly if they rise too quickly without sufficient support.
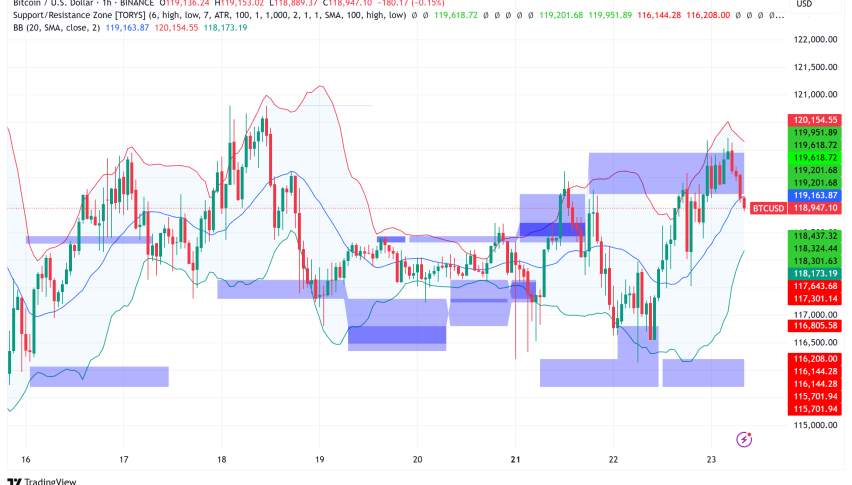
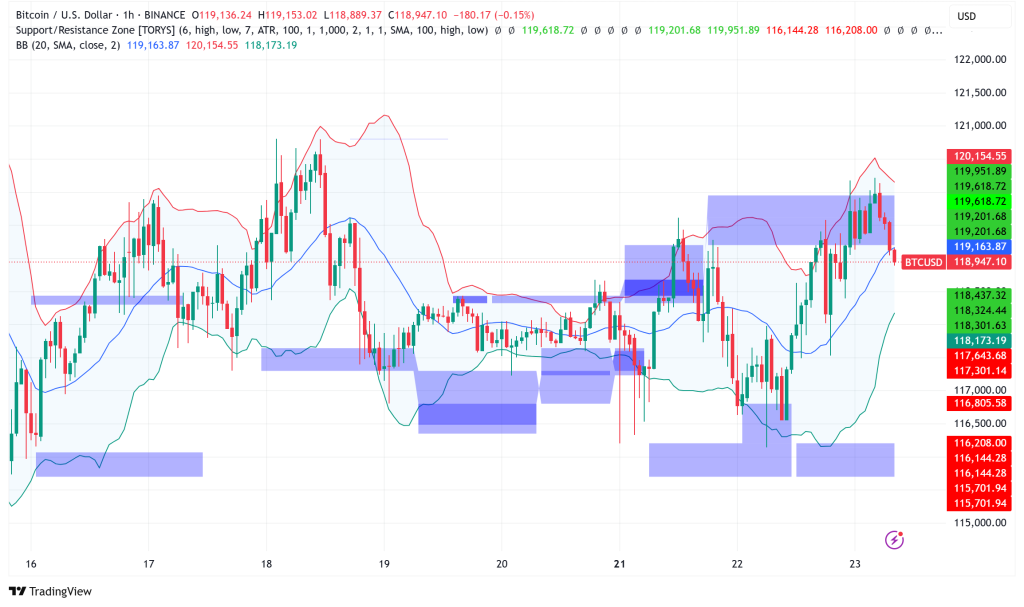
BTC/USD Technical Analysis Points to Bull Pennant Formation
Even while there are worries about volume, technical indicators imply that Bitcoin may be creating a typical bull pennant pattern, which has traditionally been linked to continuing moves in established trends. Titan of Crypto, a well-known crypto trader, has found this formation and says that the measured move of the pattern might lead to a breakout objective of $140,000.
The bull pennant shows a period of stabilization after Bitcoin rose 14% between July 8 and its most recent all-time high of almost $123,000. This technical combination, together with an inverted head-and-shoulders pattern found by analyst Merlijn The Trader, strengthens the $140,000 price target from many different points of view.
Traders should keep in mind, though, that bull pennants only work 54% of the time, which makes them one of the less trustworthy technical patterns. This statistical fact shows how important it is to manage risk in the current economy.
Regional Demand Dynamics Show Mixed Signals
Market data shows several worrying geographical tendencies that could explain the drop in sales. The Coinbase Premium Index, which shows how prices fluctuate between US and global exchanges, has been pretty much the same throughout July. This suggests that American institutional purchasers aren’t really excited about Bitcoin, even though it’s close to record highs.
The Korea Premium Index has dropped into the negative, which is more concerning because it means that Bitcoin is trading at a discount on Korean exchanges. This difference usually means that Korean retail traders are putting pressure on prices to go down, which has historically been a major cause of cryptocurrency volatility.
The Net Taker Volume on Binance has gone below $60 million, which means that most people in the market are selling instead of purchasing. Even if this bearish attitude indicator shows that people are selling, Bitcoin’s ability to stay above $115,000 shows that demand is still strong.
Institutional Adoption Provides Fundamental Support
There are still worries about the technology and the amount of Bitcoin, but more and more institutions are adopting it, which is good for its long-term future. Michael Saylor’s company MicroStrategy just bought 6,220 more BTC for $739.8 million, increasing the company’s total holdings to 607,770 BTC at an estimated cost basis of $43.6 billion.
This institutional buying, along with ongoing inflows into spot Bitcoin ETFs, provide a strong reason for prices to go up. Bernstein Research sticks to its $200,000 prediction by the end of 2025, saying that the key reason is because more institutions are using these cars.
Bitcoin Price Predictions and Risk Assessment
Different technical methods have led to price targets set by several analysts. A symmetrical triangle breakout offers a first target of $125,000. More ambitious estimates based on daily chart golden cross patterns point to $155,000.
The most important technical question right now is whether Bitcoin can stay above the $115,000–$116,000 area. If these levels hold, it might lead to a test of the previous all-time high of about $123,100. If that level breaks, it could start the following leg up toward $140,000.
On the other hand, if these support levels don’t hold, the price might test the fair value gap between $115,200 and $112,000. Many analysts see this as a good correction that could provide the market more liquidity for the next upward rise.
- Check out our free forex signals
- Follow the top economic events on FX Leaders economic calendar
- Trade better, discover more Forex Trading Strategies
- Open a FREE Trading Account
- Read our latest reviews on: Avatrade, Exness, HFM and XM