Gold Price Forecast Weekly: Buyers Fail Again—Key Levels Before Fed, Aug Tariff Decision
Gold prices are consolidating just below record levels as fading geopolitical risks and a shift in Fed expectations test the strength of...

Quick overview
- Gold prices are consolidating below record levels as geopolitical risks fade and Fed expectations shift.
- After reaching a peak of $3,500/oz in April, gold prices are showing signs of exhaustion and failing to reclaim that high.
- The 20-week simple moving average at $3,260 is a critical support level, with a break below it threatening the medium-term uptrend.
- Despite recent easing of tensions, the safe-haven demand for gold remains, although its upward momentum has flattened.
Live GOLD Chart

Gold prices are consolidating just below record levels as fading geopolitical risks and a shift in Fed expectations test the strength of the recent bullish trend.
Gold Rally Loses Steam After April Peak
After climbing sharply through late 2023 and early 2025 to reach a high of $3,500/oz in April, gold prices are now showing signs of exhaustion. Despite global uncertainty and ongoing rate speculation, buyers have failed to reclaim the peak, signaling a slowdown in momentum rather than a full retreat.
Gold Chart Monthly – Buyers Seem Exhausted
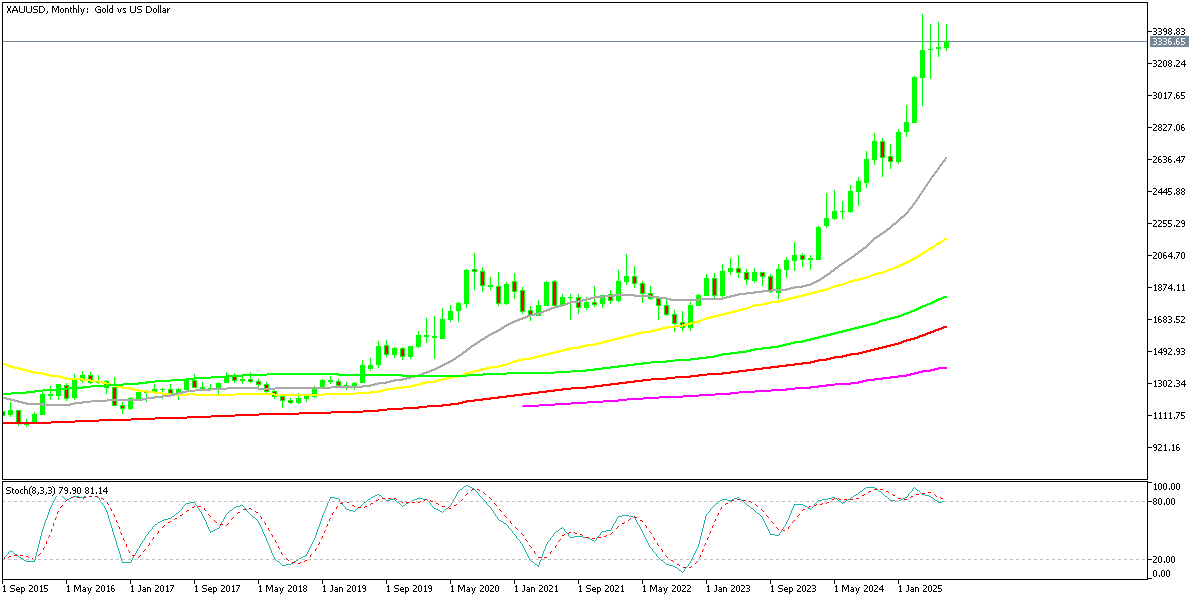
While GOLD remains well-supported by safe-haven demand—especially amid Fed policy shifts and geopolitical concerns—its upward trajectory has flattened in recent months. On the monthly chart, May and June produced two doji candlesticks, reflecting indecision in the market and hinting at a potential reversal. Attempts to break above $3,450 have repeatedly failed, keeping the metal trapped in a tight range.
Technical Landscape: The 20 MSA at $3,260 Becomes the Line in the Sand
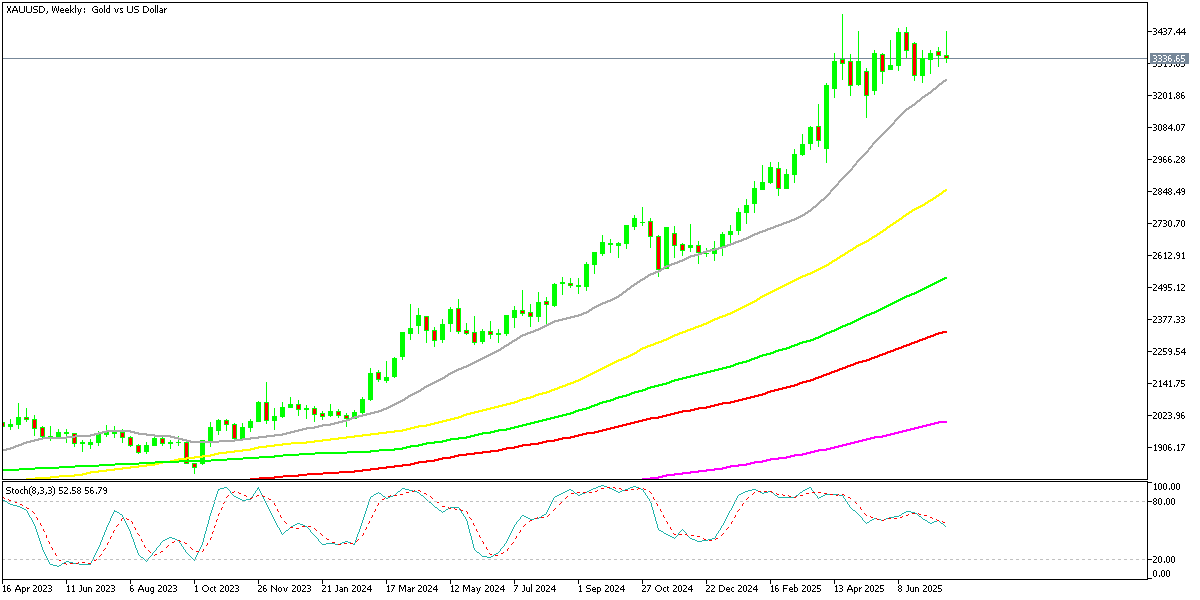
The 20-week simple moving average (SMA), currently around $3,260, has become a crucial support level for bulls. Any decisive break below it would threaten the medium-term uptrend. Last week’s $100 drop, driven by easing geopolitical tensions after a U.S.-Japan trade agreement, further weakened gold’s near-term appeal.
Despite this, the safe-haven narrative hasn’t completely vanished. The flare-up between Israel and Iran earlier this year had added a significant premium to gold prices, propelling them to $3,445/oz. But with tensions cooling, that premium has since faded.
Macro Events Take the Spotlight
Looking ahead, gold is expected to remain range-bound in the short term as markets await major central bank decisions. The upcoming US FOMC meeting, Bank of Japan’s policy stance, and developments around the August 1 deadline for US tariff talks will be critical.
Traders will also watch for key macroeconomic indicators, including the advance US GDP print, employment figures, and PCE inflation data. If these show unexpected strength, the probability of rate cuts could drop, putting further pressure on gold and possibly triggering a break below $3,260.
Conclusion: Key Inflection Point for Gold
Gold’s recent price action reflects a market in balance, torn between strong longer-term fundamentals and short-term resistance. If upcoming data reinforces the Fed’s caution, gold may weaken further. However, a resurgence in geopolitical stress or dovish central bank signals could revive bullish momentum. For now, the $3,260–$3,450 range remains critical.
Gold Live Chart
- Check out our free forex signals
- Follow the top economic events on FX Leaders economic calendar
- Trade better, discover more Forex Trading Strategies
- Open a FREE Trading Account

