Gold Price Drops to $3,335: 3 Reasons XAU/USD Could Slide Toward $3,284
Gold (XAU/USD) is down for the third day in a row and trading near $3,335. The metal is weak due to improving global trade...
Quick overview
- Gold (XAU/USD) has declined for three consecutive days, currently trading near $3,335 due to a stronger US dollar and improving global trade sentiment.
- Recent diplomatic progress has shifted investor focus towards riskier assets, diminishing gold's appeal as a safe haven.
- The upcoming Federal Reserve meeting is crucial, with expectations that rates will remain steady, further impacting gold's attractiveness.
- Technically, gold is in a bearish trend, having broken below key support levels, with a need to close above $3,365 to regain bullish momentum.
Gold (XAU/USD) is down for the third day in a row and trading near $3,335. The metal is weak due to improving global trade sentiment, a stronger US dollar and expectations of the Fed to hold rates at 4.50%. All this has taken away gold’s safe haven appeal as global risk appetite grows.
Recent diplomatic progress – a US-Japan trade deal and potential tariff cooperation with the EU – has reduced fears of a global trade war. That’s shifted investor flows towards riskier assets like equities and away from gold’s traditional defensive role. China’s mixed demand outlook is adding to the complexity. Jewelry demand plunged 26% in H1 but investment demand rose 24% – different market drivers.
Key pressure points:
- Trade optimism reduces safe-haven demand
- Stronger dollar makes gold expensive abroad
- Fed expected to hold rates, hurts gold’s appeal
Fed in Focus: Traders Eye July FOMC Outcome
The next major event for gold traders is Wednesday’s Federal Reserve meeting. While inflation has cooled, the labor market is still strong. A Reuters poll shows most analysts expect the Fed to keep rates at 4.25%–4.50% with any cuts pushed to September or later.
This “higher for longer” outlook is keeping the dollar firm and Treasury yields high. The 10-year yield is near 4.39% and gold being a non-yielding asset, this is capping its upside.
Traders are also watching upcoming US data for clues on Fed policy direction:
- July 30: ADP jobs, Advance GDP, Pending Home Sales
- July 31: PCE Price Index, Jobless Claims
- Aug 1: NFP, ISM Manufacturing, Unemployment Rate
Any surprise strength in these numbers will add to gold’s pressure.
Gold Technical Setup: Bears in Control Below $3,343
Technically, gold has broken below its ascending channel and is now below the 50-period SMA at $3,365. This confirms short-term bearish momentum. The RSI is at 35.90 – not oversold yet but showing weak buying interest.
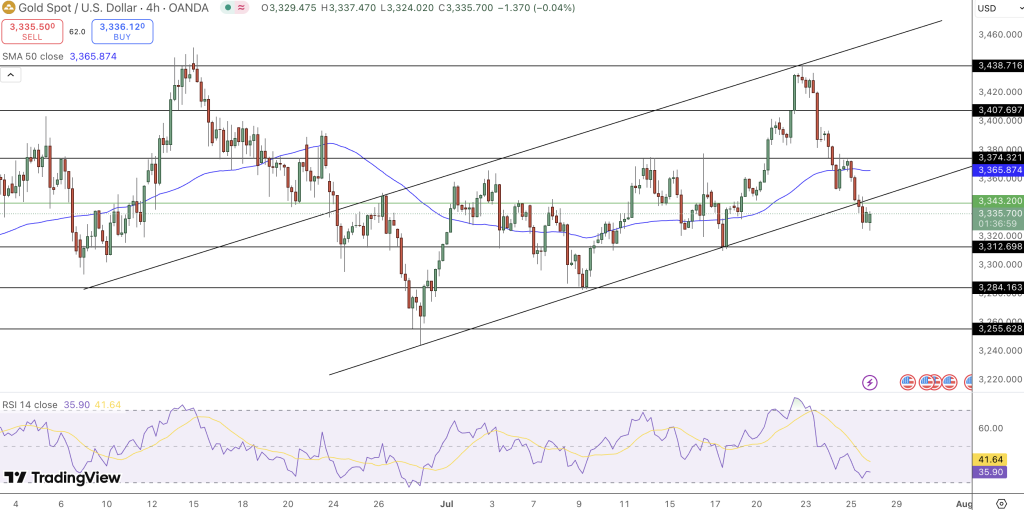
Key levels to watch:
- Immediate support: $3,320 and $3,312
- Next downside target: $3,284* Break above: $3,343 and $3,365
Gold needs to close above $3,365 to turn bulls. Until then, bears are in control.
- Check out our free forex signals
- Follow the top economic events on FX Leaders economic calendar
- Trade better, discover more Forex Trading Strategies
- Open a FREE Trading Account
- Read our latest reviews on: Avatrade, Exness, HFM and XM
Related Articles


Sidebar rates
Related Posts
