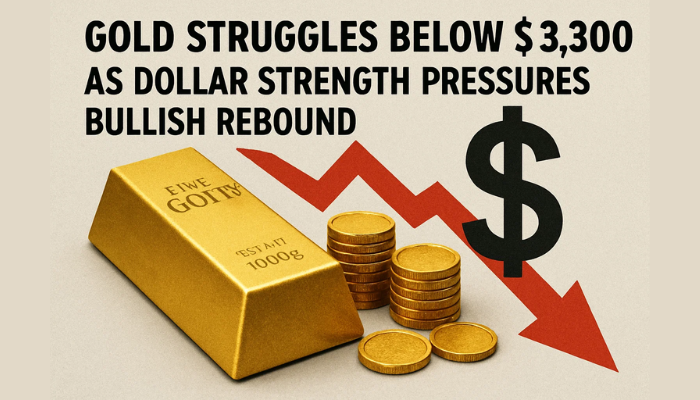
Gold Struggles Below $3,300 as Dollar Strength Pressures Bullish Rebound
Gold (XAU/USD) is hovering around $3,295 on Thursday, heading for a weekly loss as dollar strength continues to cap any upside...
Quick overview
- Gold (XAU/USD) is currently around $3,295, facing a weekly loss due to dollar strength.
- Technical indicators show gold is in a descending channel, with resistance at $3,333 and support at $3,268.
- Bulls are struggling to maintain momentum above $3,290, and the RSI indicates a lack of buyer conviction.
- Traders should wait for a breakout above $3,301 or a breakdown confirmation before making trades.
Gold (XAU/USD) is hovering around $3,295 on Thursday, heading for a weekly loss as dollar strength continues to cap any upside. A strong US economic outlook, backed by strong GDP and delayed rate cut expectations, has pushed the dollar higher – making gold more expensive for foreign buyers. According to a Reuters report, the dollar is holding near a three-week high – making gold’s recovery even tougher.
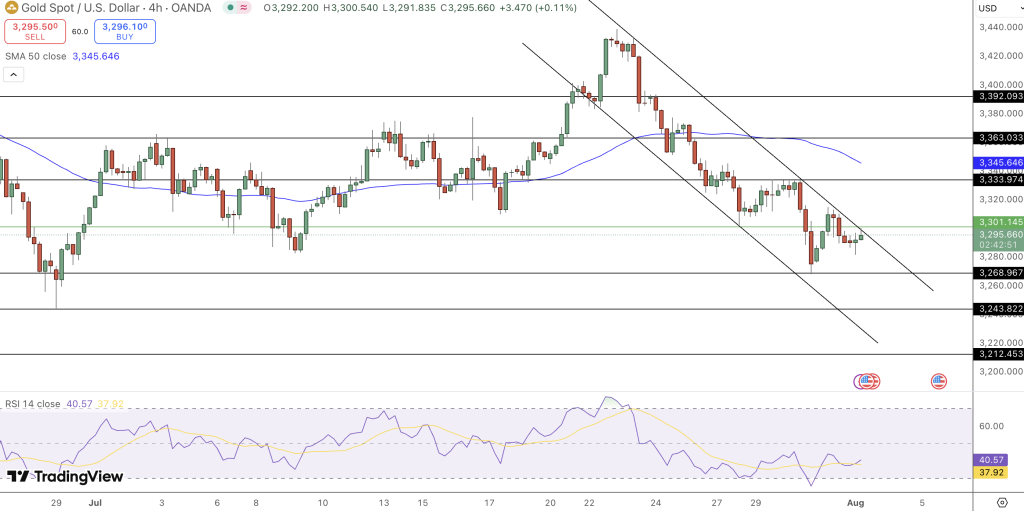
On the technicals, gold is stuck in a well-defined descending channel on the 4-hour chart. Bulls tried to push above $3,300 but couldn’t sustain the momentum. Price is below the 50-period Simple Moving Average at $3,345 and horizontal resistance at $3,333 is capping gains. With sentiment driven more by macro headlines than safe-haven bids, gold is vulnerable in the short term.
Gold Technical Levels Show Bearish Bias
Bulls have tried to stabilize price above $3,290 but the structure is weak. RSI has moved up from oversold but still below the 50 line – showing buyers lack conviction. Recent candles are showing indecision with spinning tops and dojis forming near the lower channel – a classic sign of hesitation at key support.
Unless price breaks above $3,301 and reclaims $3,333, bearish momentum remains intact. 50-SMA is acting as dynamic resistance and failure to cross above it means sellers are in control. Traders should wait for a bullish RSI crossover and strong candle confirmation before going long.
Key levels to watch:
- Immediate support: $3,268
- Next support: $3,243 then $3,212
- Resistance: $3,301 and $3,333
What to Watch Next
Gold is bearish until it breaks the channel. Until then, the path of least resistance is down. Macro drivers – dollar strength and Fed policy – will be in control. Gold could bounce short term if a key support level triggers a technical reaction.
Takeaways:
- Price is bearish as long as XAU/USD is below $3,333
- RSI below 50 means limited upside
- Wait for breakout or breakdown confirmation to trade.
- Check out our free forex signals
- Follow the top economic events on FX Leaders economic calendar
- Trade better, discover more Forex Trading Strategies
- Open a FREE Trading Account