August South African Rand Forecast: USD/ZAR Fails to Hold Above R18, Decline Resumes
The South African rand reclaimed ground against the dollar after a week of volatility driven by interest rate cuts, U.S. tariffs, and...
Quick overview
- The South African rand strengthened against the dollar after a week of volatility influenced by interest rate cuts and U.S. tariffs.
- The South African Reserve Bank cut its benchmark repo rate to 7%, initially causing the rand to weaken against the dollar.
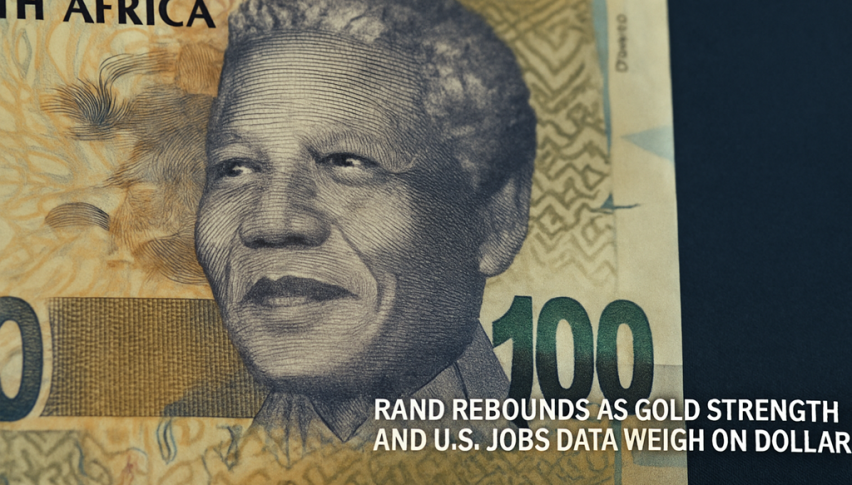
- Weak U.S. labor data and rising gold prices provided support for the rand, allowing it to recover and push USD/ZAR back below R18.
- Technical indicators suggest a cautious balance in the USD/ZAR pair, with potential for upward momentum if resistance levels are breached.
The South African rand reclaimed ground against the dollar after a week of volatility driven by interest rate cuts, U.S. tariffs, and shifting market sentiment.
Rate Cut Sparks Initial Weakness
The South African Reserve Bank (SARB) cut its benchmark repo rate by 25 basis points to 7% during its July Monetary Policy Committee meeting, prompting commercial banks to reduce the prime lending rate to 10.50%. The immediate market reaction sent the rand lower, pushing USD/ZAR to R18.36—its first sustained move above R18 since mid-May.
USD/ZAR Chart Daily – The 100 SMA Stopped the Climb

While the U.S. dollar received a boost from the August 1 implementation of broad U.S. tariffs, the rand—heavily tied to commodity cycles—struggled to maintain early-year momentum. South Africa could face challenges from the 30% levy on its U.S. exports but may offset some of the pressure by accelerating intra-African trade and diversifying export markets.
Gold and U.S. Labor Data Shift Momentum
The rand regained strength late in the week after weak U.S. labor data raised doubts about the stability of the U.S. job market, pressuring the dollar. With gold prices rising for a third consecutive session, South Africa—one of the world’s top precious metal producers—saw renewed currency support. This dual tailwind drove USD/ZAR back below R18, reversing its earlier spike and signaling that sellers remain active at higher levels.
Technical Outlook for USD/ZAR – Weekly Chart

The recent multi-month decline in USD/ZAR from above R20 to below R17.50 appears to be losing steam, but technical indicators suggest a cautious balance of forces such as the 50-month SMA has acted as a critical support zone. A positive technical reversal on the weekly chart shows the pair briefly retaking its 100-week SMA. Current candlestick patterns indicate that momentum could shift upward if resistance levels give way, though near-term sentiment favors the rand.
- Check out our free forex signals
- Follow the top economic events on FX Leaders economic calendar
- Trade better, discover more Forex Trading Strategies
- Open a FREE Trading Account