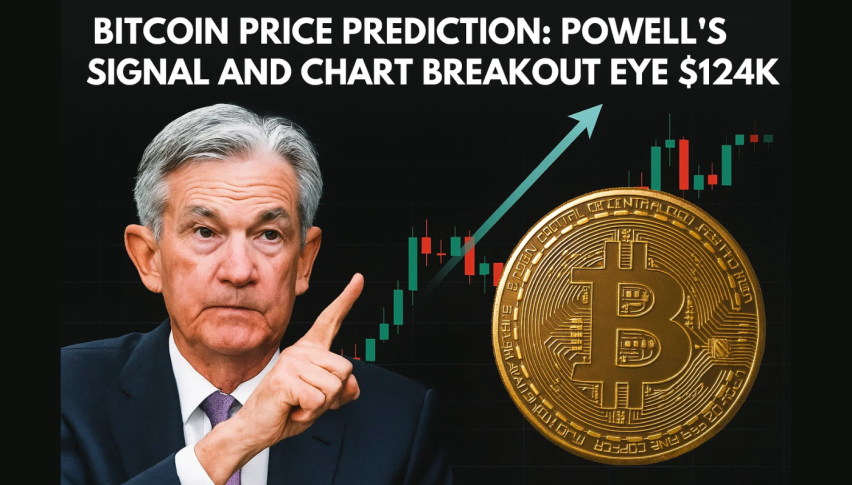
BTC Macro and Institutional Flows Keep Bitcoin’s Long-Term Bull Case Solid
After hitting consecutive peaks this summer, Bitcoin momentarily faltered but swiftly recovered to $117,000, maintaining the bullish...

Quick overview
- Bitcoin experienced a brief pullback to $117K after reaching record highs of $124K, but strong support remains intact.
- The recent correction was triggered by U.S. inflation data and a lack of government interest in increasing Bitcoin reserves, resulting in significant liquidations.
- Institutional inflows are driving the current rally, with over $35 billion in investments this year and projections of $50 billion by mid-2025.
- Despite the recent dip, Bitcoin's fundamentals and technical indicators suggest a potential rebound towards $150K in the coming months.
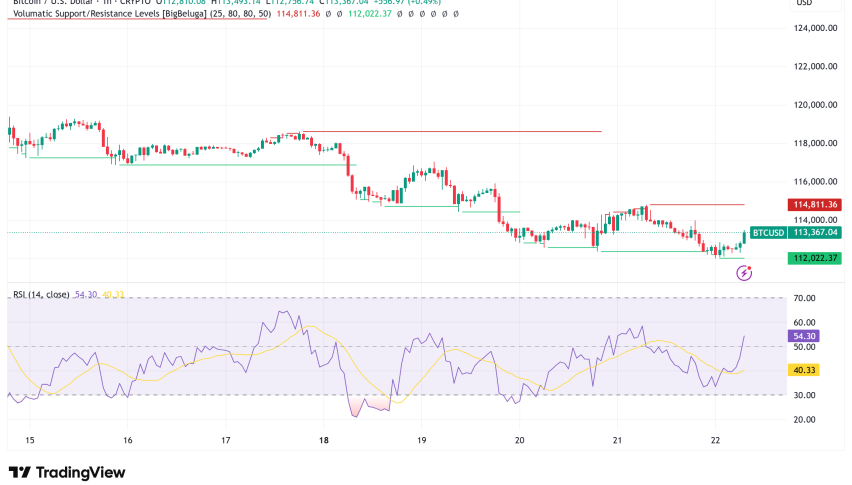
Live BTC/USD Chart

After hitting consecutive peaks this summer, Bitcoin momentarily faltered but swiftly recovered to $117,000, maintaining the bullish narrative.
From Records to Pullback
After climbing to new highs of $123,000 in July and $124,000 in August, Bitcoin appeared set on a path toward $150,000. Optimism was high, fueled by technical strength and surging institutional appetite.
However, sentiment shifted last week after hotter U.S. inflation data and Treasury Secretary Scott Bessent’s confirmation that Washington would not increase its Bitcoin reserves. That triggered a swift correction, sending BTC to weekend lows of $117,000 and wiping out over $227 million in leveraged positions.
Technical Outlook: Support Remains Firm
Despite the setback, the charts continue to flash resilience. Bitcoin’s retreat followed two doji candlesticks—classic signals of market exhaustion—before stabilizing at the 50-week SMA around $117,000.
BTC/USD Chart Weekly – The 20 SMA Held Firm

Momentum indicators also suggest recovery potential. The stochastic oscillator has already turned higher from oversold conditions, hinting at a possible rebound. If Bitcoin repeats its past bullish phases—each averaging ~$40,000 in upside—targets near $150,000 remain realistic.
Bitcoin Chart Daily – The Jump Stalled at the 20 SMA

Institutional Inflows Lead the Rally
Unlike past retail-driven cycles, this rally is dominated by institutional money. Spot Bitcoin ETFs are drawing unprecedented demand, reshaping market dynamics.
Deutsche Bank data shows more than $35 billion in inflows this year, with projections pointing toward $50 billion by mid-2025. Products like BlackRock’s iShares Bitcoin Trust (IBIT) and ARK 21Shares Bitcoin ETF (ARKB) continue to see heavy allocations, including a single-day surge of $1.17 billion in inflows last week.
Macro Drivers: Debt, Money Supply, and Global Interest
The U.S. federal debt has surged past $37 trillion, with money supply expansion amplifying long-term inflationary risks. With Bitcoin’s fixed cap of 21 million coins, many see it as a hedge against fiat debasement—a structural advantage that keeps demand strong.
Governments are also watching. In the Philippines, House Bill No. 421 proposes annual purchases of 2,000 BTC for sovereign reserves, potentially joining the U.S. and U.K. as state-level holders. Similar discussions are emerging in Malaysia, Thailand, and other nations.
Outlook: Shallow Pullback, Strong Fundamentals
Bitcoin’s weekend retreat was modest, with support levels intact and institutional demand surging. Combined with Powell’s dovish lean and favorable macro dynamics, the stage is set for BTC to attempt another leg higher—possibly toward $150K in the months ahead.
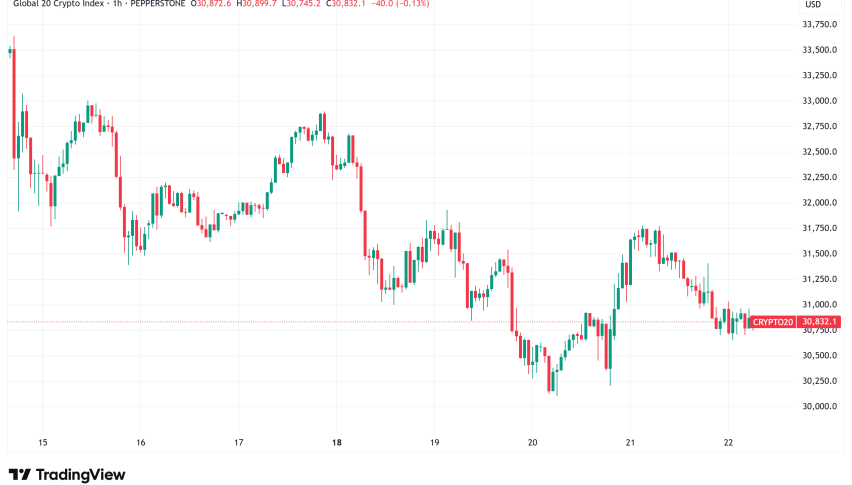
Bitcoin Live Chart
- Check out our free forex signals
- Follow the top economic events on FX Leaders economic calendar
- Trade better, discover more Forex Trading Strategies
- Open a FREE Trading Account