btc-usd
Forex Signals Brief August 28: Markets Brace for U.S. GDP and GDP Price Index
Today the US prelim GDP and GDP price index will highlight the markets in the US session, following the ECB minutes.
•
Last updated: Thursday, August 28, 2025

Quick overview
- The US prelim GDP and GDP price index are set to influence the markets today, following the ECB's steady deposit rate announcement.
- Oil prices rebounded after a significant drawdown in U.S. crude stockpiles, with WTI crude settling at $64.15.
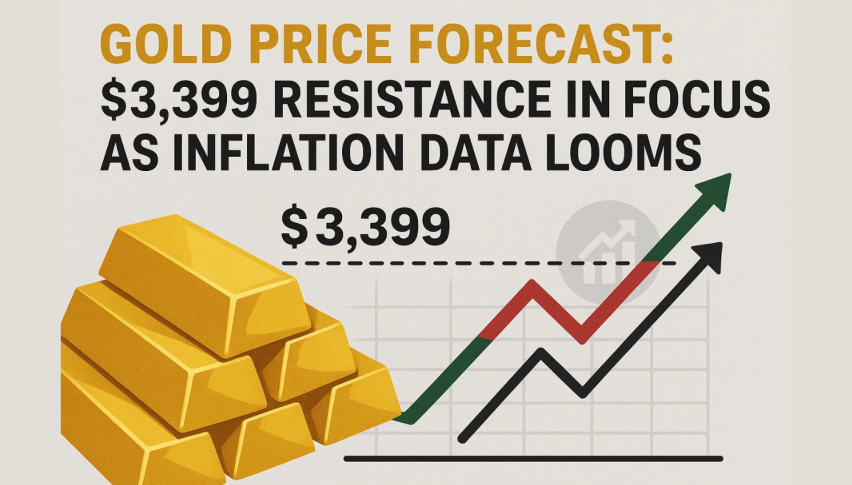
- Gold extended its gains, closing at $3,395, supported by safe-haven demand and stable labor market data.
- Nvidia's Q2 earnings beat expectations on EPS but disappointed on data center revenue, leading to a decline in shares.
Live BTC/USD Chart
BTC/USD

MARKETS TREND
Today the US prelim GDP and GDP price index will highlight the markets in the US session, following the ECB minutes.
Commodities Update
Oil markets found support from the latest EIA inventory data, which revealed another sizeable drawdown in U.S. crude stockpiles for the second consecutive week. Crude inventories fell -6.014 million barrels, encouraging a rebound in prices after weakness earlier in the week. WTI crude settled at $64.15, up $0.90 (+1.42%), just shy of the day’s high at $64.25.
Gold also managed to extend gains, closing at $3,395 after briefly dipping below $3,268 earlier in the week following the Fed’s steady-rate stance. A late rally lifted the metal nearly $50 higher, supported by safe-haven flows and steady labor market data. Technical signals suggest the $3,450–$3,500 zone remains the next key resistance area.
Corporate & Central Bank Highlights
Nvidia’s Q2 earnings delivered a beat on EPS but fell short on data center revenue, disappointing the market and sending shares lower in after-hours trading.
Key Market Events Today
ECB Minutes
On the monetary policy front, the European Central Bank held its deposit rate steady at 2%, as widely expected. The accompanying statement repeated the data-dependent, meeting-by-meeting approach while reiterating that the ECB does not specifically target exchange rates, even as the euro’s appreciation remains on the radar.
U.S. GDP and GDP Price Index in Focus
The U.S. dollar began yesterday’s session on firm footing, strengthening broadly against major peers, but those gains faded by the afternoon, leaving the FX market stuck in its familiar back-and-forth pattern. Investors now turn their attention to preliminary GDP data, expected to show growth of 3.1% compared with the prior 3.0%. Alongside this, the GDP Price Index is projected at 2.0%, offering an important read on underlying inflation trends that could shape expectations for the Federal Reserve’s next moves.
Last week, markets were quite volatile once, with gold retreating and then bouncing to finish the week close to $4,000 but yesterday it retreated again. EUR/USD continued the upward move toward 1.17, while main indices closed higher. The moves weren’t too big though, and we opened 35 trading signals in total, finishing the week with 23 winning signals and 12 losing ones.
Gold Approaches $3,400
Gold also joined the rally: after briefly dipping below $3,268/oz following the Fed’s steady-rate decision, the metal climbed nearly $50 higher by week’s end. Strong safe-haven demand and stable labor data lifted prices above the 100-day SMA, reinforcing bullish momentum. Technicals continue to highlight the $3,450–$3,500/oz zone as the next key breakout area.
Yen Recovery from ¥150 Shock
Foreign exchange markets saw sharp swings. Early in the week, U.S. yield differentials and Japanese capital outflows pushed the dollar above ¥150, but disappointing U.S. jobs data triggered profit-taking, causing the USD/JPY to slide by four yen from its peak. The move underscored persistent volatility as traders weighed Japan’s intervention risks against evolving Fed expectations.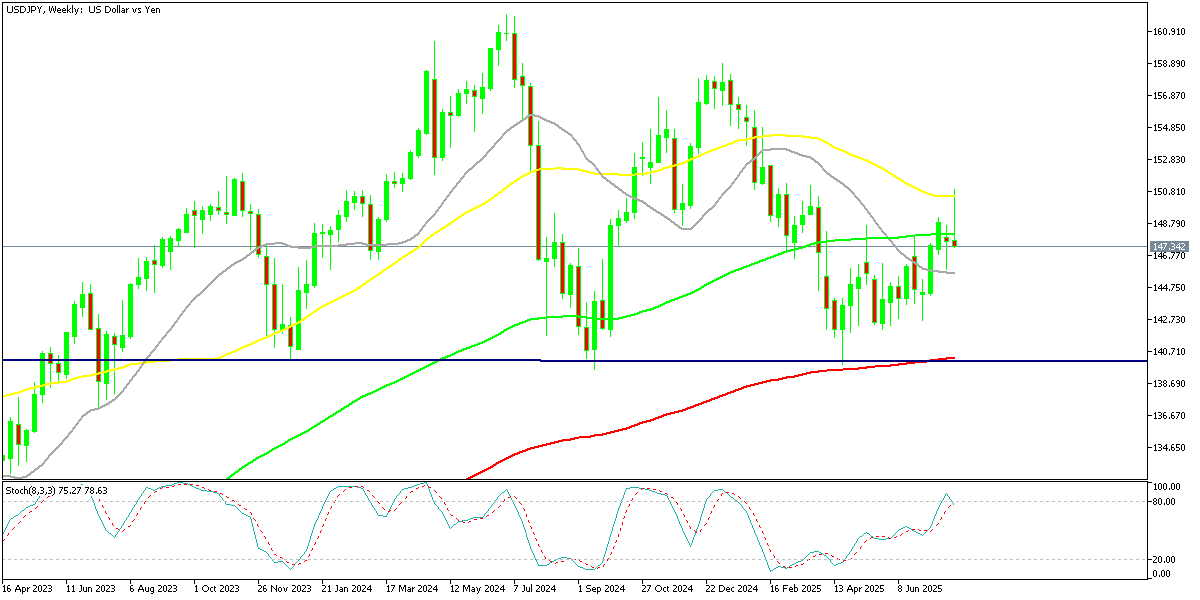
USD/JPY – Weekly Chart
Cryptocurrency Update
Bitcoin Returns Above $110K after Finding Support
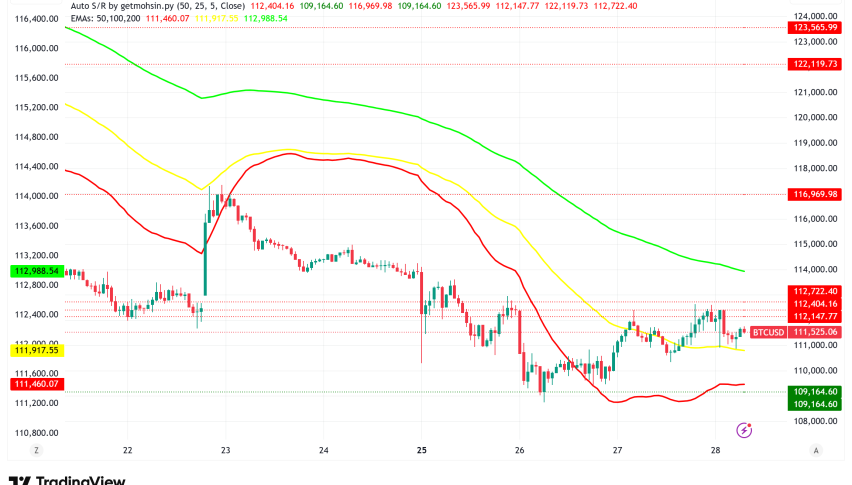
Cryptocurrencies remained highly active over the summer. Bitcoin (BTC) climbed to fresh highs of $123,000 and $124,000 in July and August, supported by institutional inflows and technical strength. However, remarks from Treasury Secretary Scott Bessent ruling out U.S. increases to BTC reserves triggered a steep pullback, sending the coin down to $113,000 before recovering above $116,000 last week, however sellers returned and sent BTC below $110,000, however we saw a rebound off the 20 weekly SMA (gray) yesterday.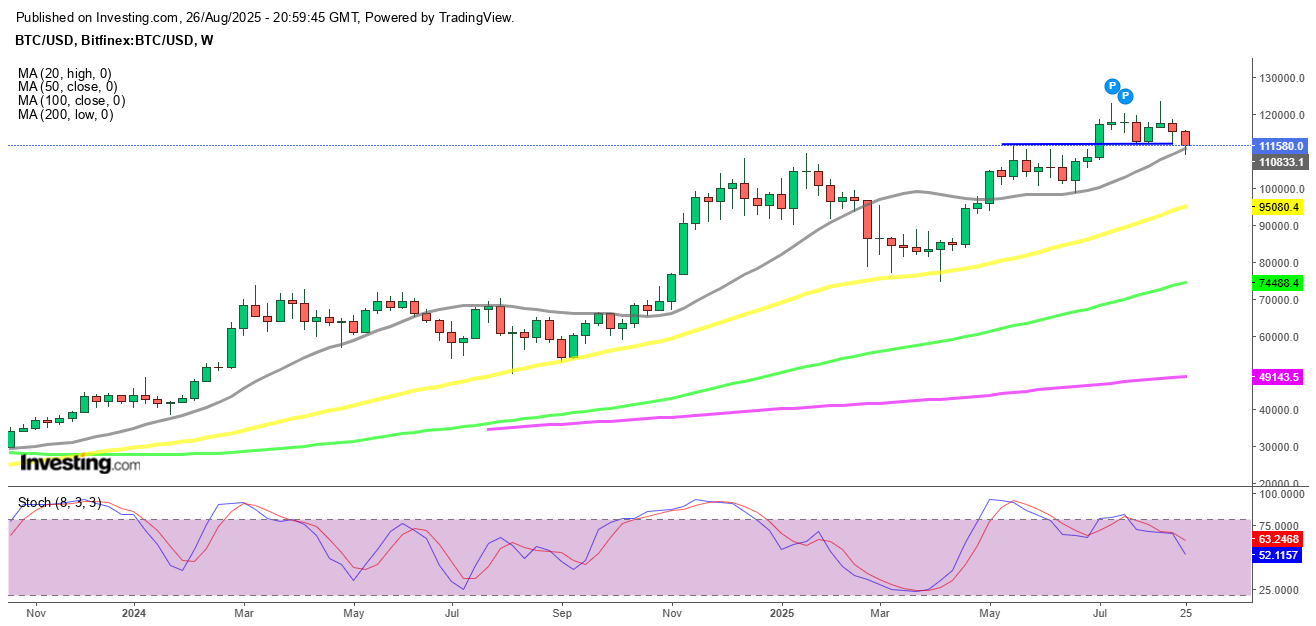
BTC/USD – Weekly chart
Ethereum Reclaims the $4,500 Level
Ethereum (ETH) has been similarly strong, surging toward $4,800, its highest since 2021 and near its all-time peak of $4,860. Despite a dip last week, ETH found support at the 20-day SMA, with retail enthusiasm and renewed institutional participation driving fresh upside momentum. However buying resumed and on Sunday ETH/USD printed another record at $4,941. However we saw a retreat to $,000 lows over the weekend, but yesterday buyers returned.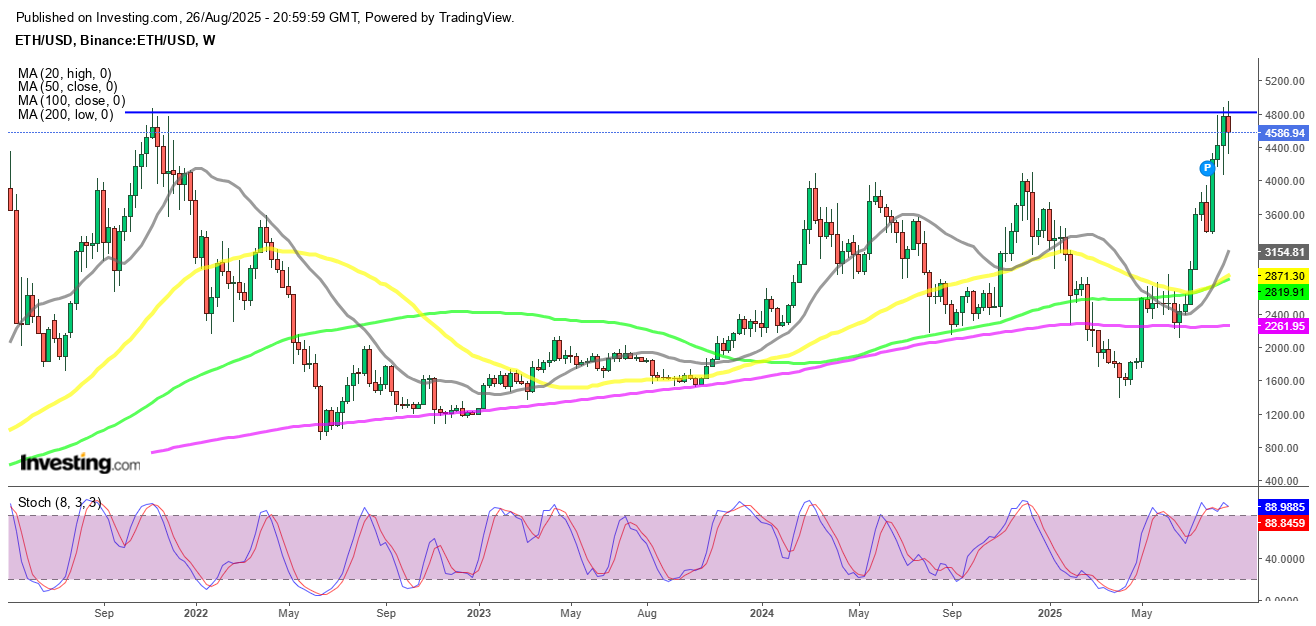
ETH/USD – Daily Chart
- Check out our free forex signals
- Follow the top economic events on FX Leaders economic calendar
- Trade better, discover more Forex Trading Strategies
- Open a FREE Trading Account
ABOUT THE AUTHOR
See More
Skerdian Meta
Lead Analyst
Skerdian Meta Lead Analyst.
Skerdian is a professional Forex trader and a market analyst. He has been actively engaged in market analysis for the past 11 years. Before becoming our head analyst, Skerdian served as a trader and market analyst in Saxo Bank's local branch, Aksioner. Skerdian specialized in experimenting with developing models and hands-on trading. Skerdian has a masters degree in finance and investment.