Ethereum Price Forecast: $4B ETF Inflows vs. Bearish Signals Below $4,401
ETH is at $4,323, down 6.1% in the last 24 hours but institutional demand is still providing a floor. SoSoValue shows Ethereum ETFs...

Quick overview
- Ethereum (ETH) is currently priced at $4,323, down 6.1% in the last 24 hours, but institutional demand remains strong with $4 billion in net inflows for Ethereum ETFs since early August.
- Major firms like Goldman Sachs and Jane Street are among the top institutional holders, indicating Ethereum's increasing importance in Wall Street portfolios.
- Despite positive inflows, Ethereum's price action shows signs of hesitation, with key resistance levels at $4,401 and support at $4,174.
- Traders are advised to consider long positions above $4,401 and short positions below $4,174, as the market is expected to make a decisive move soon.
ETH is at $4,323, down 6.1% in the last 24 hours but institutional demand is still providing a floor. SoSoValue shows Ethereum ETFs have seen $4 billion in net inflows since early August, $309 million of that on Wednesday alone. That’s 5 days in a row of positive flows while Bitcoin ETFs have seen $800 million in outflows this month.
Bitwise CIO Matt Hougan calls it a “relentless bid for ETH” while major firms like Goldman Sachs, Jane Street, Millennium Management and DE Shaw are among the top institutional holders. Analysts say it’s a sign of Ethereum’s growing role as a core digital asset for Wall Street portfolios.
Whales have added 1.44 million ETH in August, addresses holding 10,000-100,000 ETH are accumulating aggressively and corporate treasuries are growing too. BitMine Immersion and SharpLink Gaming now hold 3.3 million ETH worth $15 billion.
🚨 ETHEREUM ETF MADNESS: $4B monthly inflows just shattered all records!
While Bitcoin ETFs bled -$800M, institutional money is ROTATING into $ETH at lightning speed ⚡
This week's data will blow your mind 👇#ETH #ETF #Ethereum #Crypto
— Crypto Bhrata (@Cryptobhrataa) August 29, 2025
Ethereum (ETH/USD) Faces Resistance as Momentum Fades
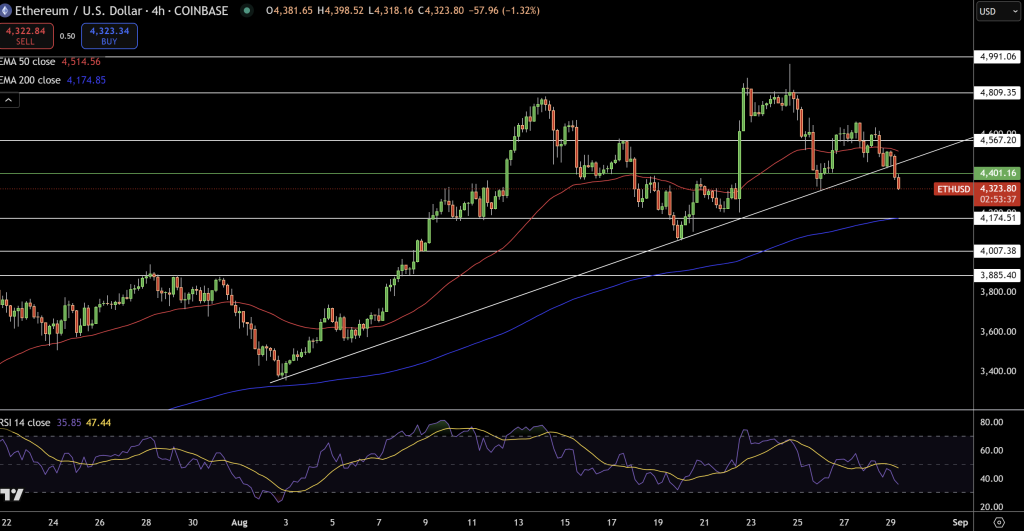
Despite the inflows, Ethereum’s price action is hesitant. ETH was rejected above $4,567 and slipped below the ascending trendline, a sign of bullish control weakening. Price is below the 50-EMA at $4,514 but above the 200-EMA at $4,174 which is deeper support.
Candlestick patterns show long upper wicks, profit taking. RSI is at 35, near oversold and MACD is turning negative, bearish pressure building. $88 million in liquidations in the last 24 hours, $63 million of that in longs.
Key levels to watch:
- Up: reclaim $4,401 and it could rally to $4,567 and $4,809.
- Down: fails $4,174 and it could slide to $4,007 and $3,885 if selling accelerates.
Ethereum Technical Outlook and Trade Setup
Ethereum’s break below the trendline means we’re shifting from strength to indecision. The structure still favors accumulation on dips but confirmation is needed.
- Bullish: above $4,401 with volume and it’s a path to $4,809.* Down: below $4,174 and it’s $4,007 and $3,885.
For traders, it’s simple. Longs above $4,401 with stops under $4,174, shorts below $4,174 with stops above $4,401. With the structure compressing, something will give in the next few days.
- Check out our free forex signals
- Follow the top economic events on FX Leaders economic calendar
- Trade better, discover more Forex Trading Strategies
- Open a FREE Trading Account
