Bitcoin Bounces Back: Can It Sustain the Rally Above $111,000?
Bitcoin (BTC) may be on the mend, as its price has stayed above $111,000 after a significant rise from recent lows. The market is currently
Quick overview
- Bitcoin's price has stabilized above $111,000 after a recent rise, with a crucial resistance level at $113,650.
- A breakout above $113,650 could signal a trend change and potential gains, while a drop below $100,000 remains a possibility due to historical volatility in September.
- On-chain data indicates increased buyer confidence in Bitcoin, with more transactions occurring at recent price levels compared to Ethereum.
- Current market dynamics show significant liquidity changes, suggesting a potential accumulation period despite some long-term holders selling assets.
Bitcoin BTC/USD may be on the mend, as its price has stayed above $111,000 after a significant rise from recent lows. The market is currently paying attention to a crucial resistance level around $113,650.
If the price breaks above this level, it might mean that the trend is going to change and more gains are on the way. But experts warn that there is still a chance that the $100,000 support level may be tested again, especially since Bitcoin has been very volatile in September in the past.
Bitcoin’s On-Chain and Market Flows Suggest a Shift
Recent data from on-chain and exchange movement show that buyers in the Bitcoin market are becoming more confident. Glassnode says that Bitcoin’s Cost Basis Distribution (CBD) shows more transactions happening at recent price levels than Ethereum does, which suggests that buyers are more interested in Bitcoin. This is an important sign because this kind of distribution has historically linked to stronger price support.
Also, there is a big change in liquidity going on. According to CryptoQuant statistics, Coinbase’s netflow rose from multi-year lows between August 25 and 31, while Binance’s 30-day simple moving average (SMA) netflow reached levels not seen since July 2024.
The fact that netflows are at both a low and a high point on key exchanges at the same time shows that reserves are being moved around in a big way. This could be the start of a new accumulation period. Long-term holders have been selling some of their assets, but their spending is still within the normal range for cycles. This suggests that this is a controlled distribution rather than a mass sell-off.
BTC/USD Technical Analysis and Price Prediction
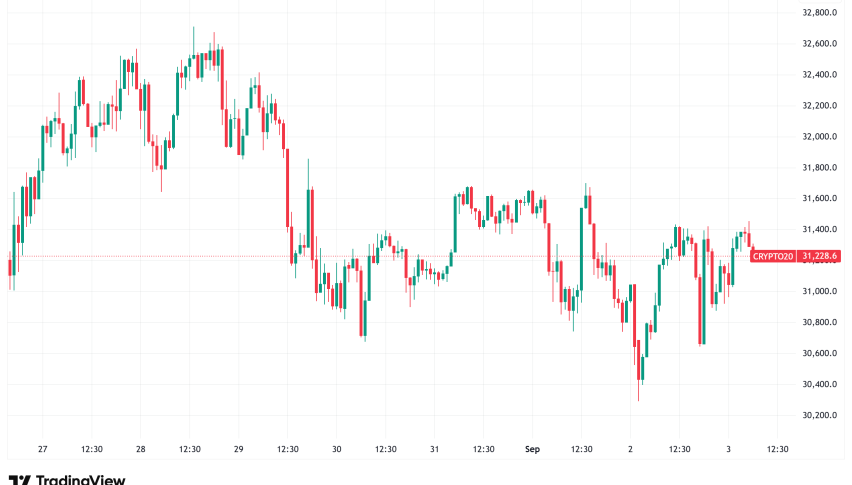
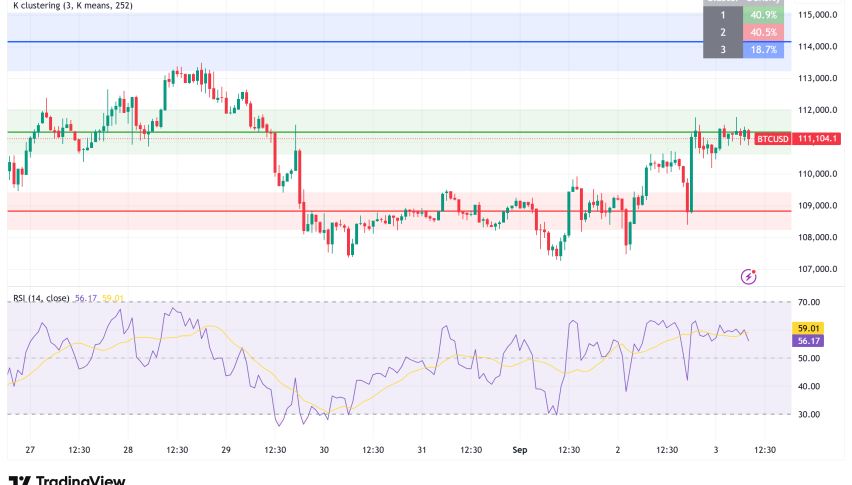
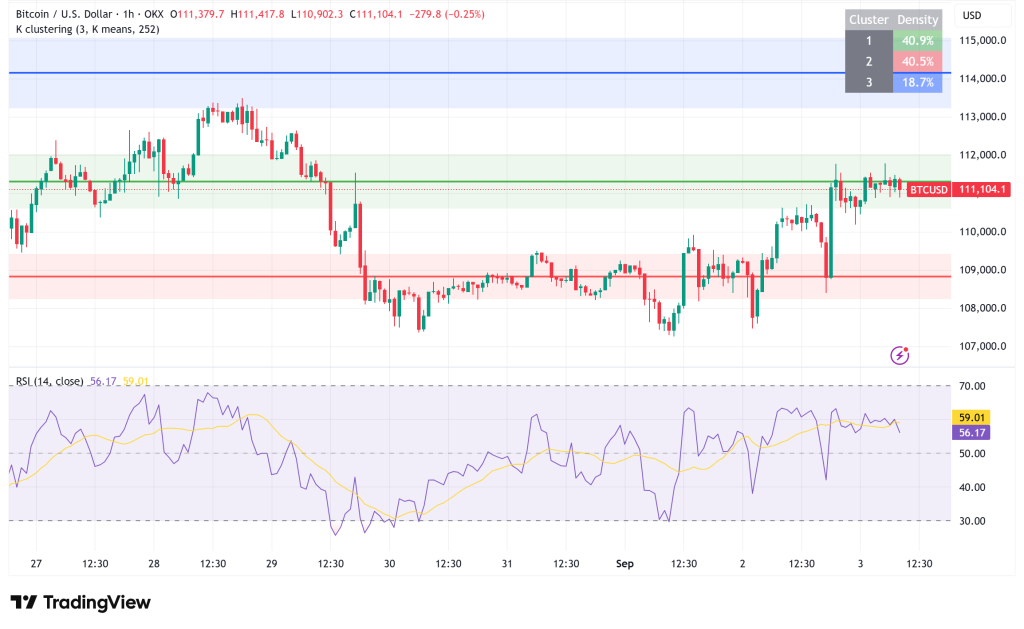
Bitcoin’s price has been stable lately. The currency bounced back from a low of $107,300 and is now trading above $111,000. The Relative Strength Index (RSI) has gone back over 50 on the four-hour chart, which is an indication that bullish sentiment is developing.
BTC, on the other hand, is facing heavy resistance right now between $112,500 and $113,650. If the market closes above $113,650 every day, that would be a strong bullish signal that would halt the previous downturn and possibly lead to liquidity goals at $116,300, $117,500, and $119,500.
On the other hand, traders should be aware of the big risks on the downside. Some others think that the price could potentially drop to the psychological $100,000 support level in the next few days because September is usually a bad month for prices.
If the price doesn’t stay above $113,650, selling pressure might start up again, and the price could drop to the support zone between $105,000 and $100,000. The market is currently in “wait and see” mode, and a clear breakout over key resistance or a breakdown below key support will probably decide what happens next.
- Check out our free forex signals
- Follow the top economic events on FX Leaders economic calendar
- Trade better, discover more Forex Trading Strategies
- Open a FREE Trading Account