Forex Signals Brief Sept 3: Precious Metals Shine, Gold and Silver Hit Multi-Year Highs
Markets kicked off the U.S. trading week with turbulence, yet safe-haven assets like gold and silver stood out as clear winners.

Quick overview
- Markets experienced turbulence at the start of the U.S. trading week, with safe-haven assets like gold and silver emerging as clear winners.
- The S&P 500 closed lower despite a partial recovery, reflecting cautious sentiment in U.S. equities.
- Gold rallied to its highest level since April, driven by softening central bank tightening expectations and increased safe-haven demand.
- In the forex market, the U.S. dollar showed volatility against the yen, influenced by profit-taking and disappointing jobs data.
Live GOLD Chart
Markets kicked off the U.S. trading week with turbulence, yet safe-haven assets like gold and silver stood out as clear winners.
U.S. Equities
The start of the week was risk-off, though not as severe as feared. At one point, futures slipped more than 1.3% before staging a partial recovery. The S&P 500 managed to close 45 points above its intraday lows but still finished 45 points lower, underscoring cautious sentiment. Financials and transportation stocks led the laggards, while Nvidia lost 1.8%.
U.S. Dollar and Forex
The U.S. dollar saw sharp swings. Early in trading, USD/JPY gave up half its gains due to profit-taking, but buyers soon returned. Still, the pair remains volatile. The broader dollar benefited from strong U.S. yields, though intervention risk in Japan kept traders on edge. By week’s start, the dollar had surged above ¥150 before pulling back four yen on weaker jobs data.
Precious Metals
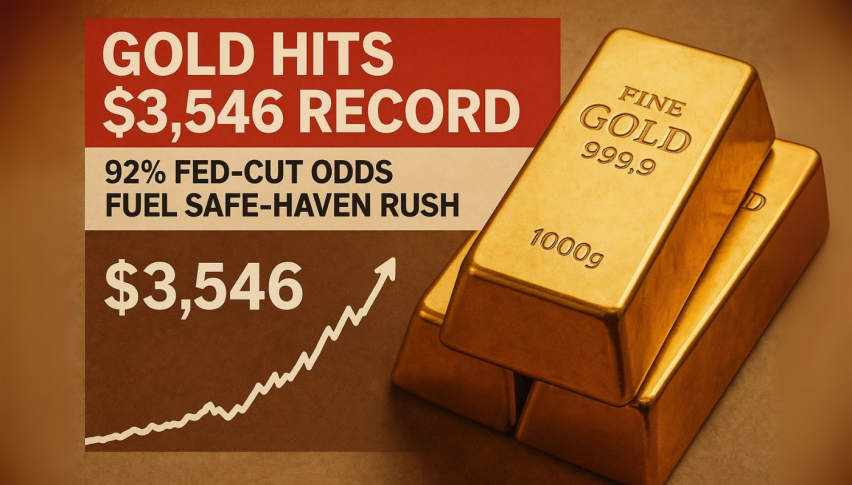
Gold was the main story of the day. After dipping to $3,475 in early U.S. trade, it rallied to close near $3,540—its highest since breaking out of the consolidation phase that began in April. The rally marks five consecutive days of gains, leaving gold just $25 below last year’s record high. Silver was equally strong, jumping to its highest level in 14 years. Both metals benefited from softening expectations of aggressive central bank tightening and heightened safe-haven demand.
Oil
Crude oil was active as well. WTI hit $66.00 per barrel before retreating to $64.55, later bouncing modestly to $65.64. The volatility reflects ongoing uncertainty in supply-demand balances and broader macro sentiment.
Key Market Events Today
Australian Q2 GDP Report
Attention is shifting to global economic indicators. In Australia, Q2 GDP is expected to show sluggish momentum, with forecasts suggesting just 0.4% Q/Q growth. Westpac noted that public demand is underperforming, while non-residential building activity and machinery investment remain weak.
US JOLTS Job Openings
In the U.S., the JOLTs Job Openings report is in focus this week, ahead of Friday’s nonfarm payrolls (NFP). Job openings have been trending lower, slipping to 7.44 million in July and 7.38 million in August, reflecting cooling labor market conditions.
Last week, markets were quite volatile once, with gold retreating and then bouncing to finish the week close to $4,000 but yesterday it retreated again. EUR/USD continued the upward move toward 1.17, while main indices closed higher. The moves weren’t too big though, and we opened 35 trading signals in total, finishing the week with 23 winning signals and 12 losing ones.
Gold Approaches Key Resistance
Following a decline following the Fed’s steady-rate announcement, gold prices rose back above $3,500/oz, rising nearly $70 higher for the day as UK bond rates spiked higher, causing risk sentiment to shift to the negative. Stable labor data, robust safe-haven demand, and a clear break above the 100-day simple moving average are all contributing to the momentum. Following the breakout above $3,500, which is a new record high for XAU, technical charts now indicate that the $3,600/oz zone is the next important resistance region.
Yen Holds In A Tight Range
Foreign exchange markets saw sharp swings. Early in the week, U.S. yield differentials and Japanese capital outflows pushed the dollar above ¥150, but disappointing U.S. jobs data triggered profit-taking, causing the USD/JPY to slide by four yen from its peak. The move underscored persistent volatility as traders weighed Japan’s intervention risks against evolving Fed expectations.
USD/JPY – Weekly Chart
Cryptocurrency Update
Bitcoin Reclaims the $110K Level Again
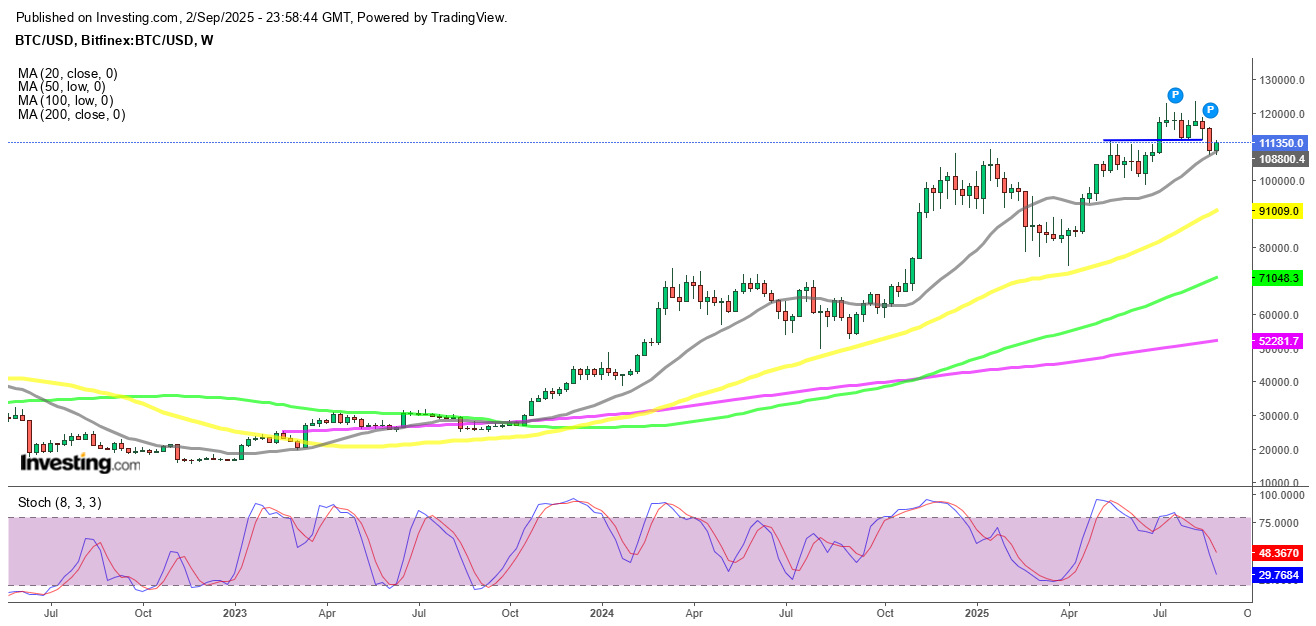
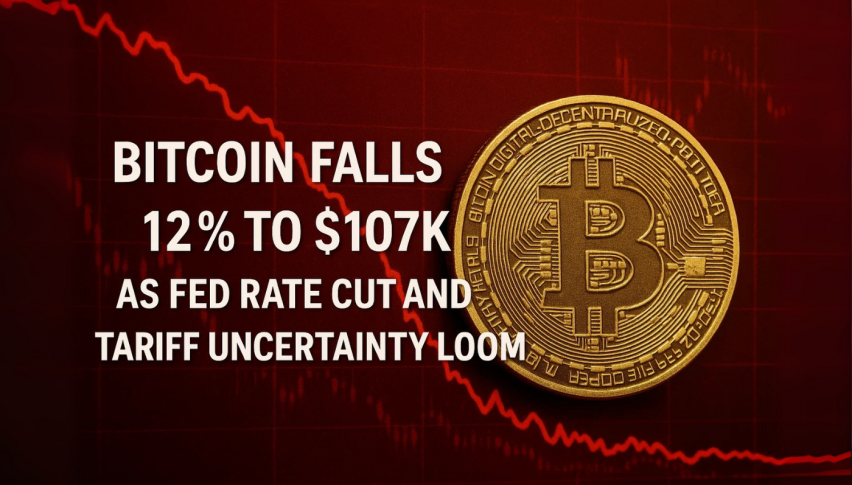
Cryptocurrencies remained highly active over the summer. Bitcoin (BTC) climbed to fresh highs of $123,000 and $124,000 in July and August, supported by institutional inflows and technical strength. However, remarks from Treasury Secretary Scott Bessent ruling out U.S. increases to BTC reserves triggered a steep pullback, sending the coin down to $113,000 before recovering above $116,000 last week, however sellers returned and sent BTC below $110,000, however we saw a rebound off the 20 weekly SMA (gray) yesterday.
BTC/USD – Weekly chart
Ethereum Heads to the $4,500 Level Again
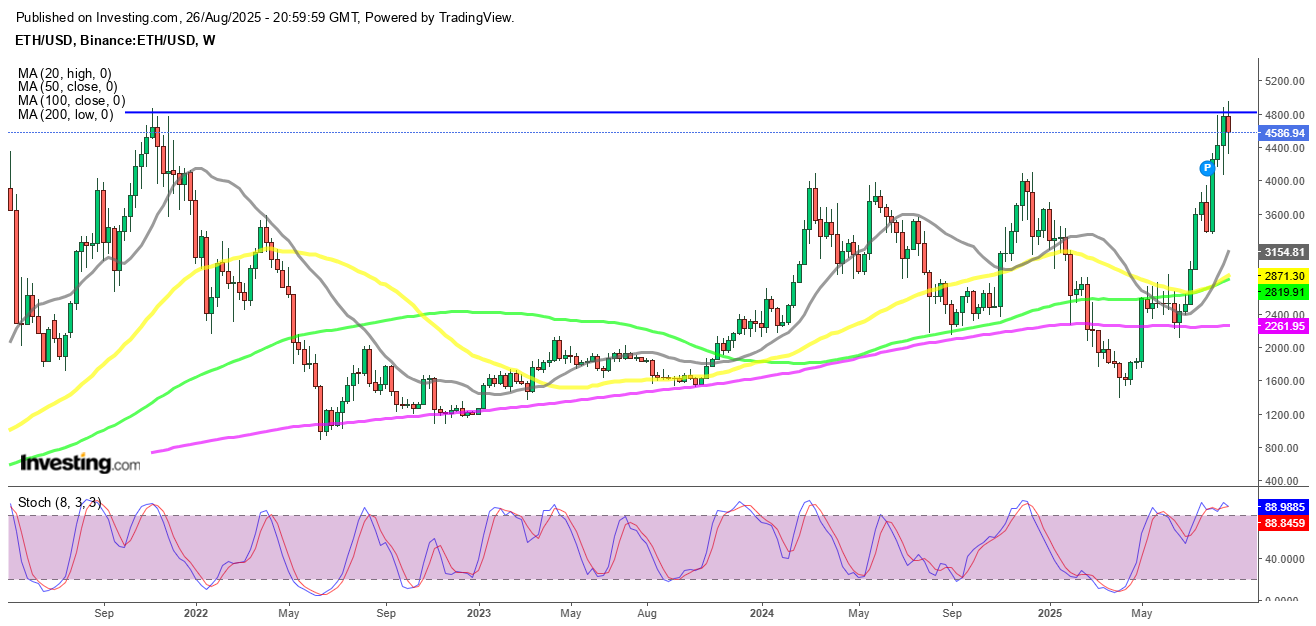
Ethereum (ETH) has been similarly strong, surging toward $4,800, its highest since 2021 and near its all-time peak of $4,860. Despite a dip last week, ETH found support at the 20-day SMA, with retail enthusiasm and renewed institutional participation driving fresh upside momentum. However buying resumed and on Sunday ETH/USD printed another record at $4,941. However we saw a retreat to $,000 lows over the weekend, but yesterday buyers returned.
ETH/USD – Daily Chart
- Check out our free forex signals
- Follow the top economic events on FX Leaders economic calendar
- Trade better, discover more Forex Trading Strategies
- Open a FREE Trading Account


