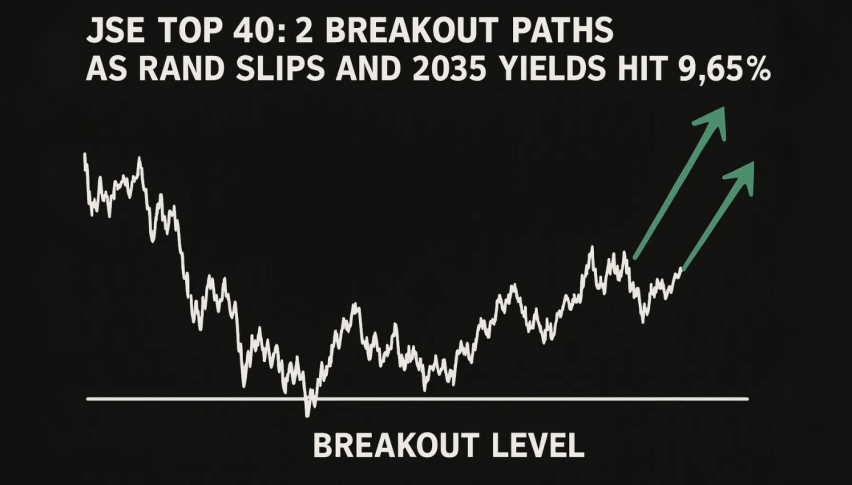
JSE Top 40: 2 Breakout Paths as Rand Slips and 2035 Yields Hit 9.65%
SA’s equity benchmark edged up 0.16% as investors waited for new data and US cues. The cash index closed at 101,332.35...
Quick overview
- SA's equity benchmark rose 0.16% as investors awaited new data and US cues, closing at 101,332.35.
- The rand weakened due to domestic demand and a softer export pulse, while August's PMI indicated slower output.
- Bond yields increased, with the 2035 yield rising to 9.65%, creating headwinds for equity valuations.
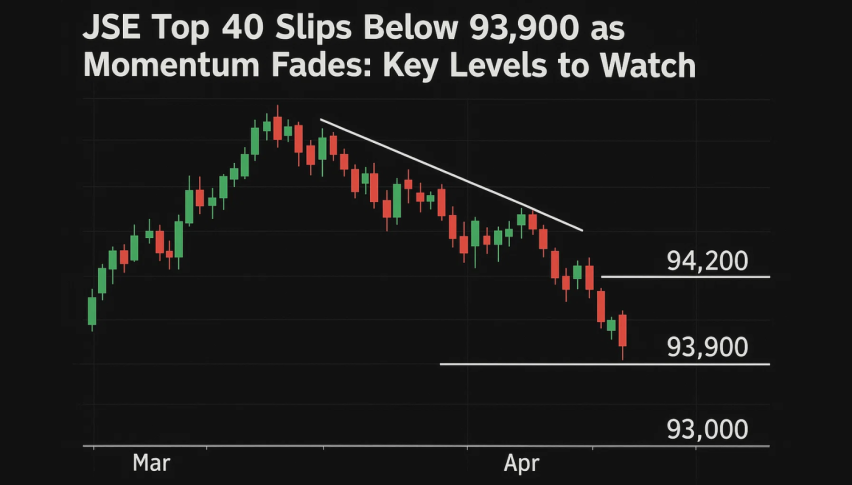
- The JSE Top 40 is at a critical juncture, with potential targets depending on whether it breaks above 94,940 or below 93,492.
SA’s equity benchmark edged up 0.16% as investors waited for new data and US cues. The cash index closed at 101,332.35 but the short term picture is neutral with buyers stepping in on dips and sellers fading rallies. Safe-haven positioning ahead of JOLTS and the Fed’s Beige Book meant local shares tracked macro headlines rather than fundamentals.
Rand, PMI and bonds
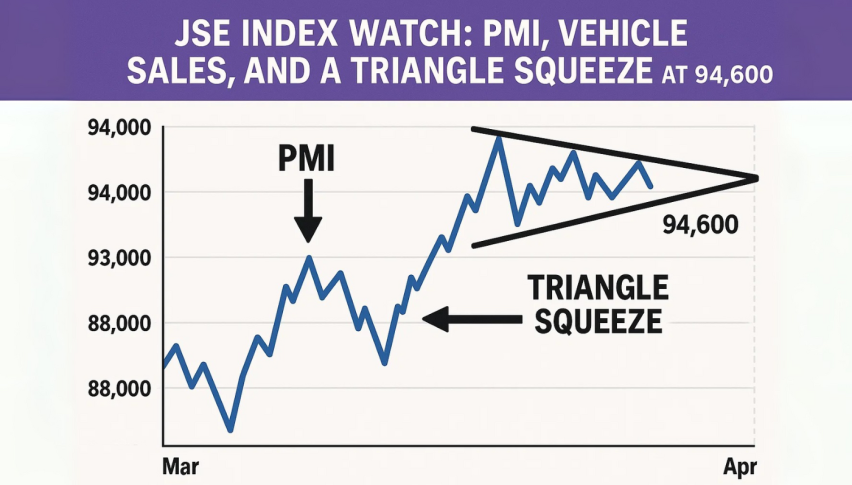
The backdrop is mixed. The rand weakened in early trade on domestic demand and a softer export pulse. August’s whole-economy PMI slipped back after July’s brief improvement and is hinting at slower output and weaker order books.
Bond yields ticked up: the 2035 yield rose 2.5 bps to 9.65% which is a headwind for equity valuations. Add in a stronger US dollar and unresolved global trade questions and sentiment is cautious not fearful.
What to watch
- August PMI trajectory and revision to new-orders components
- US labour data for global risk appetite
- Rand sensitivity to shifting Fed expectations
- SA bond yields and equity multiple pressure
JSE Top 40: Triangle builds; trade plan
The JSE Top 40 is coiling inside a triangle. Price is testing trendline resistance at 94,940 while the rising base above 93,500 is attracting dip buyers. The 50-SMA at 94,359 has flattened into a pivot and the 200-SMA at 90,093 is the longer term support. Momentum is stabilising: RSI ~49 has recovered from oversold and the MACD histogram is fading.
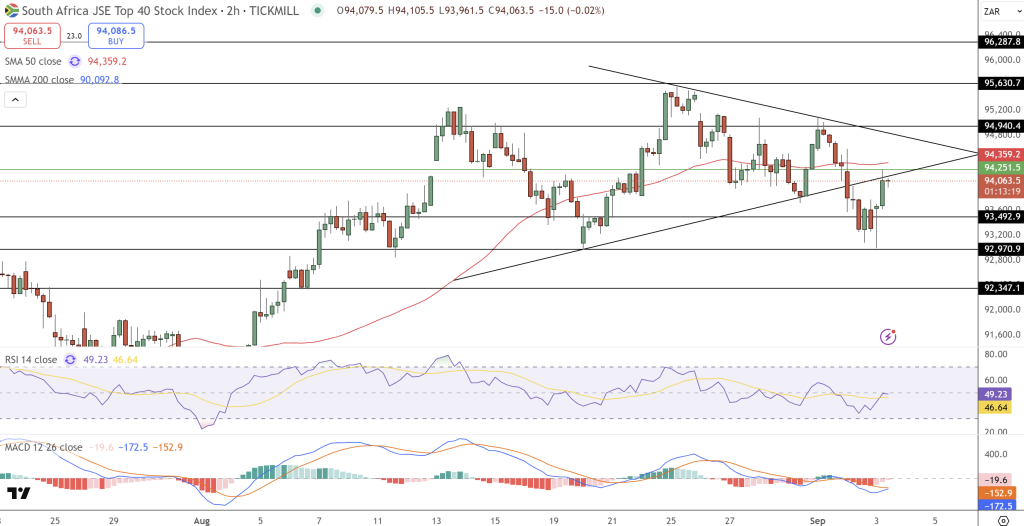
For traders the market is at a decision point. A close above 94,940 would confirm the break and target 95,630 and 96,287. A close below 93,492 would hand it to the sellers and target 92,970 and 92,347.Keep it simple. Risk defined.
Long above 94,950, stop below 94,250, target 95,630-96,200 if the squeeze goes higher. Short on a break below 93,490, stop above 93,950, target 92,970-92,340 if the pattern plays out.
Triangles often break fast; waiting for a clear candle—a bullish engulfing on breaks or a strong red body on breaks—adds confidence before you commit.
- Check out our free forex signals
- Follow the top economic events on FX Leaders economic calendar
- Trade better, discover more Forex Trading Strategies
- Open a FREE Trading Account