Gold Price Prediction: XAU/USD Nears $3,700 as Fed Cuts and CPI Loom Large
Gold (XAU/USD) is up for a third day above $3,650. Soft US jobs data has reinforced the view of rate cuts at the September 16-17 Fed meeting

Quick overview
- Gold (XAU/USD) has risen for three consecutive days, currently trading above $3,650, driven by soft US jobs data and expectations of rate cuts from the Fed.
- Silver (XAG/USD) is also up at $41.39, benefiting from similar dovish Fed expectations and increased demand for safe havens amid geopolitical instability.
- Political turmoil in Japan and France, along with tensions in Eastern Europe, are further enhancing gold's appeal as a safe-haven asset.
- Traders are anticipating upcoming US inflation data, which could influence rate cut expectations and impact gold's price trajectory.
Gold (XAU/USD) is up for a third day above $3,650. Soft US jobs data has reinforced the view of rate cuts at the September 16-17 Fed meeting. Traders are now pricing in up to 3 cuts by year end which has left the US dollar at its weakest since late July and is driving safe haven flows into gold.
Silver (XAG/USD) is following suit and is up at $41.39. Both metals are getting support from dovish Fed expectations, weaker labor data and sustained demand for havens in a world of uncertainty.
Geopolitics and Inflation in Focus
Broader political instability is adding to gold’s appeal. Japan is in leadership turmoil after PM Shigeru Ishiba resigned and France is grappling with fresh political fractures after PM Francois Bayrou’s failed confidence vote. Tensions in Eastern Europe including renewed sanctions talk and conflict risks are also underpinning bullion.
• Spot gold hits all-time high near $3,650/oz
• Markets price in 3 Fed rate cuts in 2025, starting with 25bps next week
• Focus shifts to US PPI & CPI data later this week for policy signals
• Safe-haven demand supported by tariff uncertainty & geopolitical risks— Amit Gupta (@amit_gupta444) September 9, 2025
Markets are now waiting for US inflation data next week with CPI and PPI. A softer print could reinforce rate cut expectations and drive XAU/USD towards the next technical levels.
Gold (XAU/USD) Technical Picture Points Higher
Gold is still in an uptrend on the 2 hour chart with higher highs and higher lows. It’s consolidating at $3,645 just below resistance at $3,659. The 50-SMA at $3,580 and 200-SMA at $3,421 are trending higher and are in alignment across short and long term momentum.
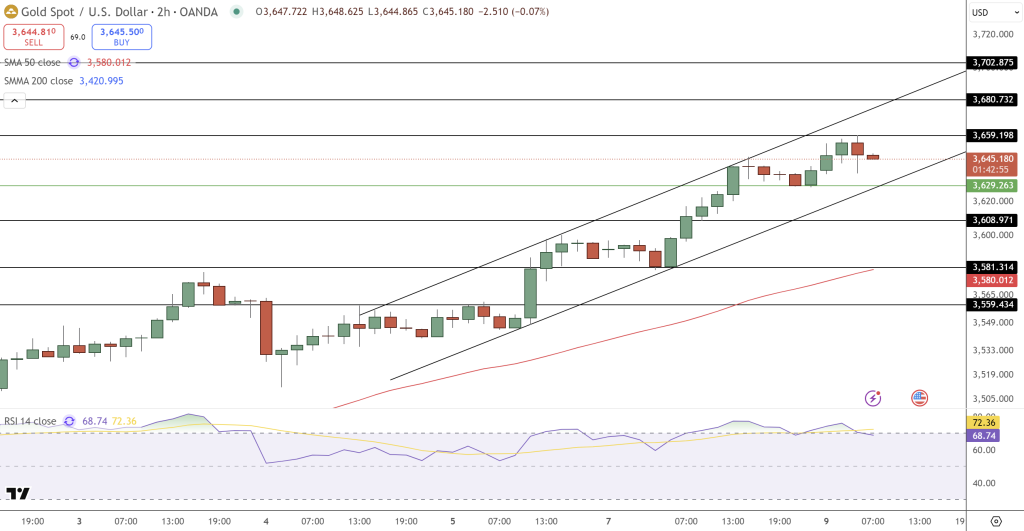
Candlesticks show healthy consolidation with no bearish reversal signals like shooting stars, engulfing patterns or three black crows. However the RSI at 72 is overbought and we could see a brief pullback to $3,629 or $3,608 before another leg higher.
Trade Setup for Beginners
- Entry: Above $3,629.
- Targets: $3,659 → $3,680 → $3,703.
- Stop-loss: Below $3,608.
This is a classic trend following trade – wait for confirmation, keep stops tight and ride the momentum to the resistance zones.
- Check out our free forex signals
- Follow the top economic events on FX Leaders economic calendar
- Trade better, discover more Forex Trading Strategies
- Open a FREE Trading Account