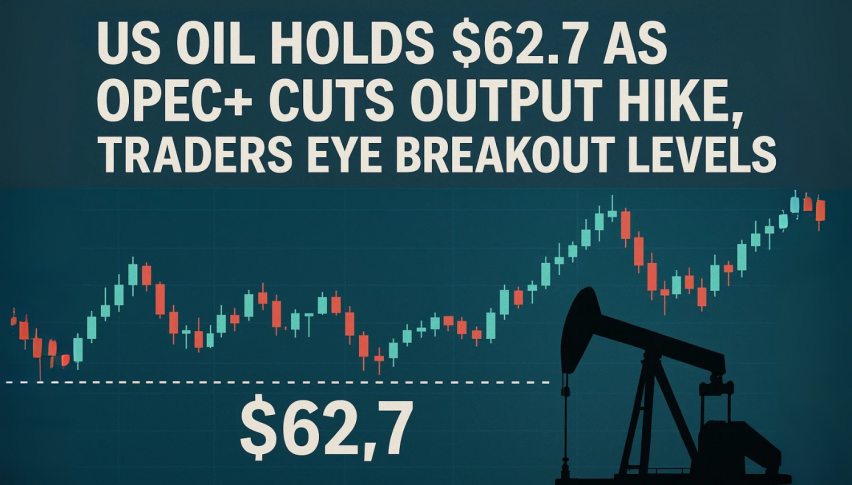
US Oil Holds $62.7 as OPEC+ Cuts Output Hike, Traders Eye Breakout Levels
WTI crude oil futures rose to $62.4 on Tuesday as markets reacted to OPEC+ production changes and geopolitical risks...
Quick overview
- WTI crude oil futures rose to $62.4 amid OPEC+ production changes and geopolitical risks.
- OPEC+ announced a smaller output increase of 137,000 bpd, reflecting caution over potential global supply surplus.
- US sanctions on Russia could disrupt crude flows, adding uncertainty to the supply outlook.
- Saudi Arabia's price cuts for Asian buyers indicate softer demand, contributing to a cautious global market sentiment.
WTI crude oil futures rose to $62.4 on Tuesday as markets reacted to OPEC+ production changes and geopolitical risks. The group announced a smaller 137,000 bpd increase from October, well below the 555,000 bpd seen in August and September.
The move shows producers are cautious as global supply is at risk of surplus. Meanwhile US President Donald Trump has threatened to impose tougher sanctions on Russia after its heaviest strikes on Ukraine since the war began. Any new restrictions could disrupt Russian crude flows and add to the supply outlook.
Demand Signals Mixed
Despite the geopolitical tension, upside was capped by Saudi Arabia cutting October prices to Asian buyers. Lower prices to the world’s biggest crude market means softer demand and a more cautious global outlook.
- OPEC+ output hike: 137,000 bpd from October
- US sanctions risk: disruption to Russian flows
- Saudi cuts: October prices lowered for Asian buyers
The combination of weaker demand signals and Fed-driven macro uncertainty has traders cautious, balancing supply concerns with slowing consumption.
Technical Outlook for WTI Crude
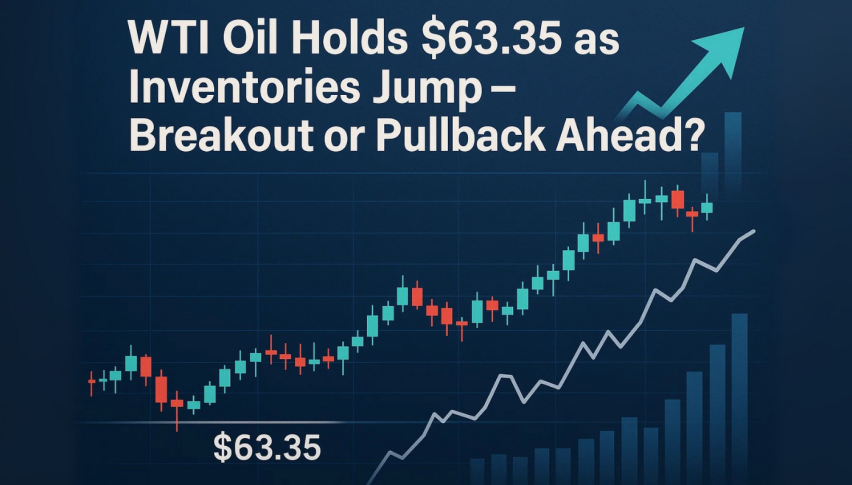
WTI crude is trading at $62.76, just below the descending trendline that has capped the recovery since the September 3rd selloff. The 50-period moving average at $63.03 is resistance, with further barriers at $63.20-$63.50. Support is holding at $62.06 and $61.44.
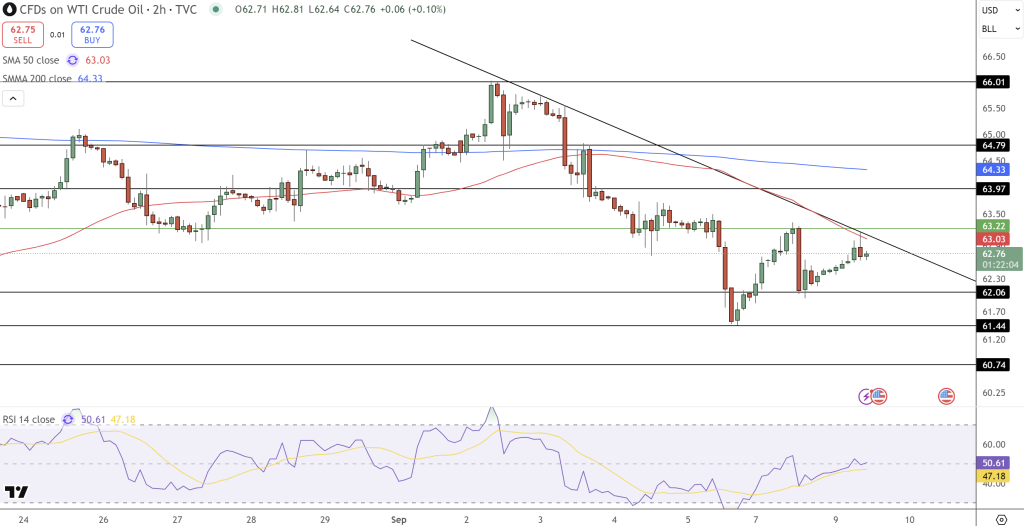
The RSI is at 50, neutral after rebounding from oversold. Recent candles are small-bodied, suggesting indecision and a potential spinning top. Unless price breaks above $63.20, sellers are in control.
Trade Setup:
A close above $63.20 could see $63.97-$64.33. Rejection at resistance may see $62.00 and $61.40. Traders may look to risk-managed entries at these levels.
- Check out our free forex signals
- Follow the top economic events on FX Leaders economic calendar
- Trade better, discover more Forex Trading Strategies
- Open a FREE Trading Account