Silver Price Analysis: $41 Holds as Fed Bets and Chart Patterns Align
Silver (XAG/USD) is holding at $41.08 after a small pullback that matched gold’s cautious tone. It fell 0.30% earlier but is still showing..
Quick overview
- Silver (XAG/USD) is currently at $41.08, showing resilience despite a recent pullback and short-term pressure from a stronger dollar.
- Key support levels are at $40.91, while resistance is noted at $41.66 and $42.22, with the price in a rising parallel channel since late August.
- Candlestick patterns indicate consolidation and indecision, with momentum indicators suggesting a balanced market without clear control from buyers or sellers.
- Traders are advised to consider a long position at $41.00-$41.10, with specific targets and stop-loss levels outlined based on channel dynamics.
Silver (XAG/USD) is holding at $41.08 after a small pullback that matched gold’s cautious tone. It fell 0.30% earlier but is still showing resilience as the Fed is expected to cut rates next week. With equities at all time highs and the dollar slightly stronger, silver is under short term pressure but the bigger picture is still positive.
Price Channel and Key Support Levels
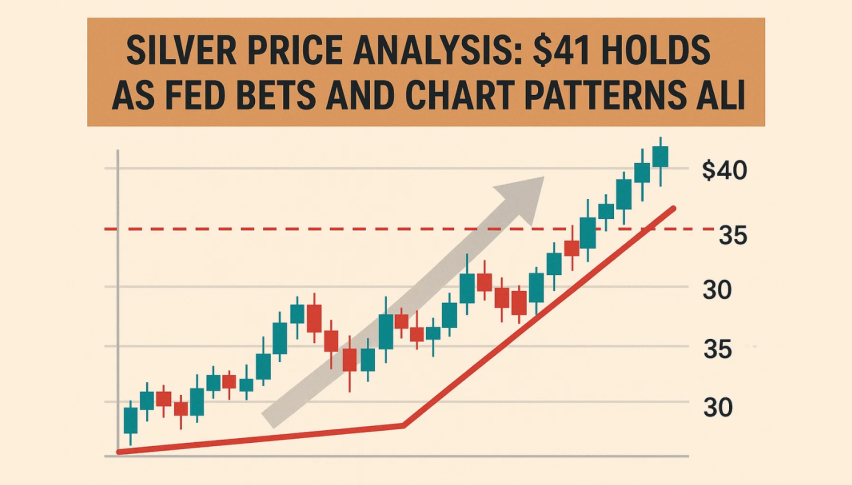
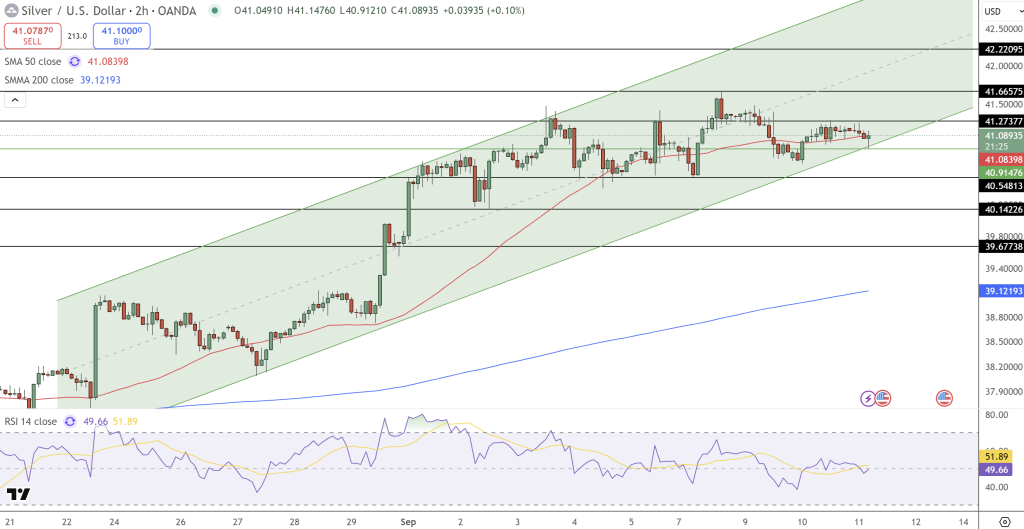
On the 2 hour chart silver is in a rising parallel channel that has held since late August. The lower channel line at $40.91 has been a good support and resistance is at $41.66 and the upper channel line at $42.22.
Moving averages are also confirming. The 50-SMA is at $41.08 and is in line with price, so it’s a pivot level. Below that the 200-SMA at $39.12 is the longer term trend line and a strong support for traders.
[[XAG/USD-graph]]
Key levels to watch:
- Support: $40.91, $40.54, $40.14
- Resistance: $41.66 and $42.22
Candlestick and Momentum Signals
Candlesticks are showing consolidation rather than reversal. Sideways candles and narrow bodied dojis are indicating indecision as the push and pull between risk on and safe haven demand continues. A break above $41.66 would be a sign of renewed momentum and a break below $40.91 would be a slide to $40.14.
Momentum indicators are also showing balance. The RSI is at 49, just below neutral, so neither buyers nor sellers have full control. This flat reading is a cooling of the bullish momentum but not weakness. If the RSI gets closer to 40 it could be oversold within the channel and a buying opportunity.
Silver (XAG/USD) Outlook and Trade Setup
The Fed easing backdrop is still supporting silver especially with geopolitical tensions ongoing. For traders the channel is the framework: above $40.91 the bullish case is alive and above $41.66 could open the way to $42.22.
Trade: Long at $41.00-$41.10 with stop at $40.54. Targets are $41.66 and $42.22. If the channel holds. Below $40.54 and the setup is invalid and we could see deeper losses to $39.12.
- Check out our free forex signals
- Follow the top economic events on FX Leaders economic calendar
- Trade better, discover more Forex Trading Strategies
- Open a FREE Trading Account