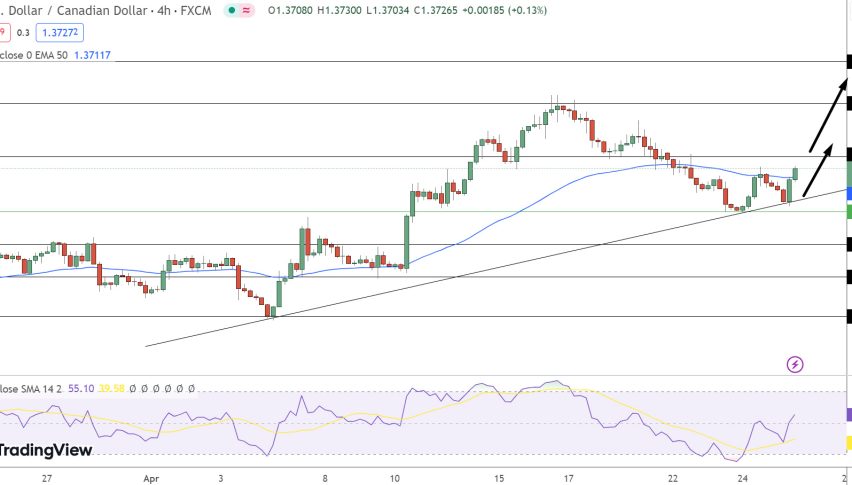
USD/CAD has been in a sloppy downtrend during the month of May, but over the last few weeks, we have seen some consolidation taking place. I would call it a retrace or a pullback; it was overdue and the stochastic indicator reached the overbought area on the H4 forex chart several times.
The price reached the 100 SM on the same timeframe chart a few days ago. It just kissed it slightly and immediately reversed. Since then this forex pair has traded in another downtrend, although nowhere as steep as the previous downtrend.
These slower trends are easier to trade in my opinion, particularly with short-term forex signals, since there are many retraces developing on slower trends, which is where we enter the market.
One such occasion presented itself just a while ago in this pair. USD/CAD climbed around 35 pips in the last two hours, but the 20 SMA on the H1 chart was stationary at 1.3460, which is where this pair started feeling dizzy.
I followed the price action for a while and after failing to break above the 20 SMA, I decided to pull the trigger on this pair and open a sell forex signal.
At the moment, that signal looks pretty good; besides the 20 SMA, the last hourly candlestick closed as a pin, which is a reversing signal. The sellers are pushing lower now, so let’s wait until we reach our take profit target, unless US oil inventories or Canadian building permits ruin our plans.
I’m having some trouble uploading the charts today, so the updates will be without forex charts. Please, stay with me until we get that fixed.


