The Daily Chart Setup Points Increasingly to a Bearish Reversal


AUD/USD has turned quite bullish this month. The contraction we saw in US ISM manufacturing at the beginning of this month started the decline for the USD and the bullish reversal for this pair. Then, the Brexit deal between the EU and Boris Johnson and the partial US-China trade deal improved the sentiment in financial markets and as a result, AUD/USD climbed more than 200 pips this month.
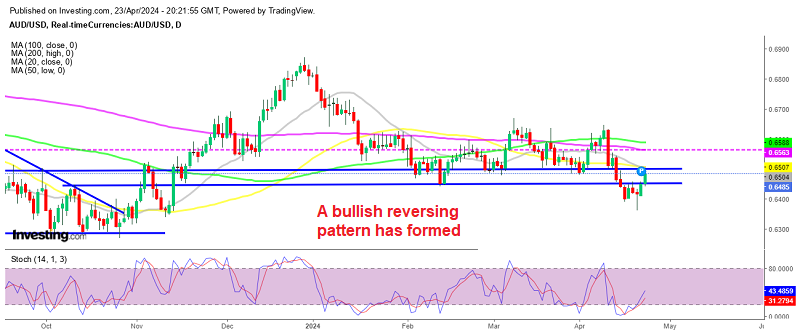
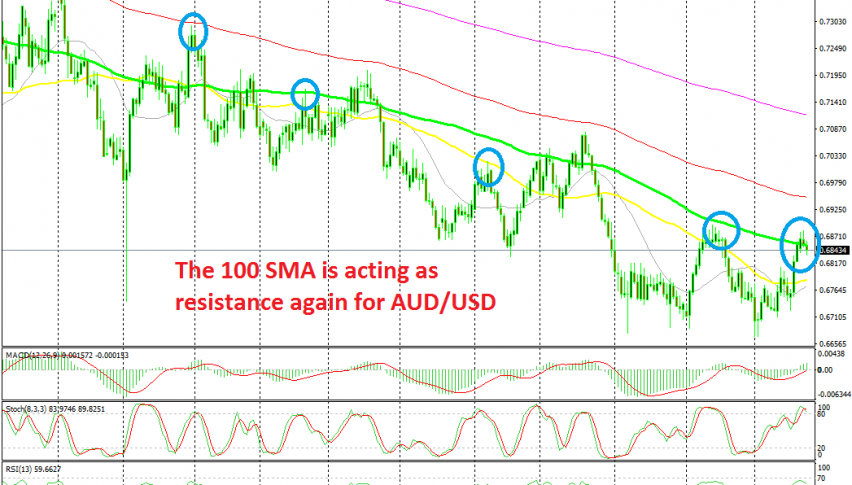
But, this is nothing special if we look at the daily chart. We have seen such retraces manu times before, the last decent one taking place in September. All pullbacks higher have ended at one of the moving averages and last month the pullback ended below the 100 SMA (green).
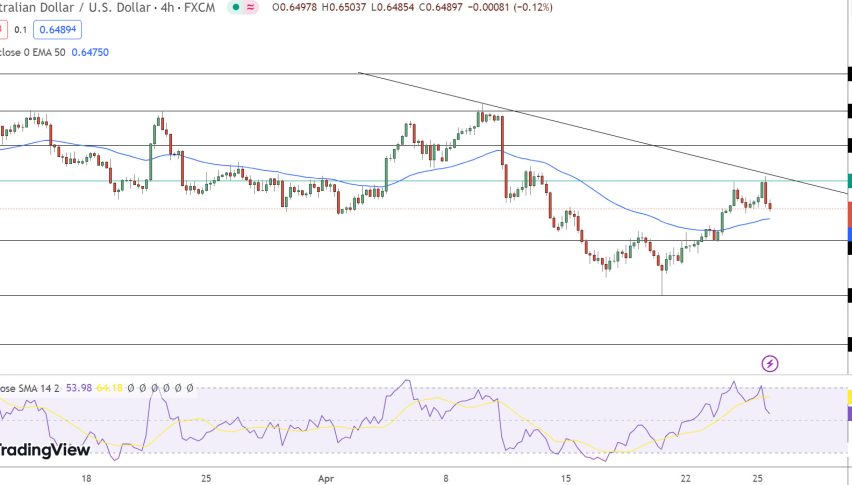
Now we are back at the 100 SMA once again and despite breaking above it on Friday, the break is not clear and the price has reversed below it, so the 100 SMA is acting as resistance again. The 0.6880-90 area was the high in September, which is adding strength to the resistance and now the chart setup points to another bearish reversal.
Stochastic is overbought and Monday’s candlestick closed as an upside-down hammer, which is a reversing signal, followed by a bearish candlestick yesterday. This might be a good opportunity to open a long term sell signal, but the FED is expected to cut interest rates again on this month’s meeting, so I’m staying on the sidelines until then.