Bullish Reversing Setup for USD/JPY
USD/JPY has been on a steady bullish trend for most of this month, but at the end of last week Donald Trump released one of his usual bombs.
USD/JPY has been on a steady bullish trend for most of this month, but at the end of last week Donald Trump released one of his usual bombs and financial markets went through a period of mini panic. As a result, safe haven assets caught some strong bids and USD/JPY dived nearly 250 pips from top to bottom. But, the H4 and the daily charts are pointing up at the moment, so let’s have a look at these two charts.
The H4 Time-Frame Chart
The H4 chart is severely oversold, as the stochastic indicator shows. Stochastic is a great indicator which lets you know when a pair is oversold or overbought. In fact, both stochastic and RSI are oversold. They are now turning higher which is a bullish sign.
The 100 SMA (red) is another indicator which goes in favour of the buyers. It has provided support previously for USD/JPY and it is doing the same thing now. Although it was briefly broken, the price has moved back above it, so it still stands as support.
The doji candlestick was the last bullish sign to signal an entry for USD/JPY buyers. The doji is a reversing candlestick and the ones that followed look pretty bullish to me. Three bullish candlesticks followed the doji, so the reversing pattern is well in progress. Although, the buyers must take out the 100 simple MA (green) so to remain in control.
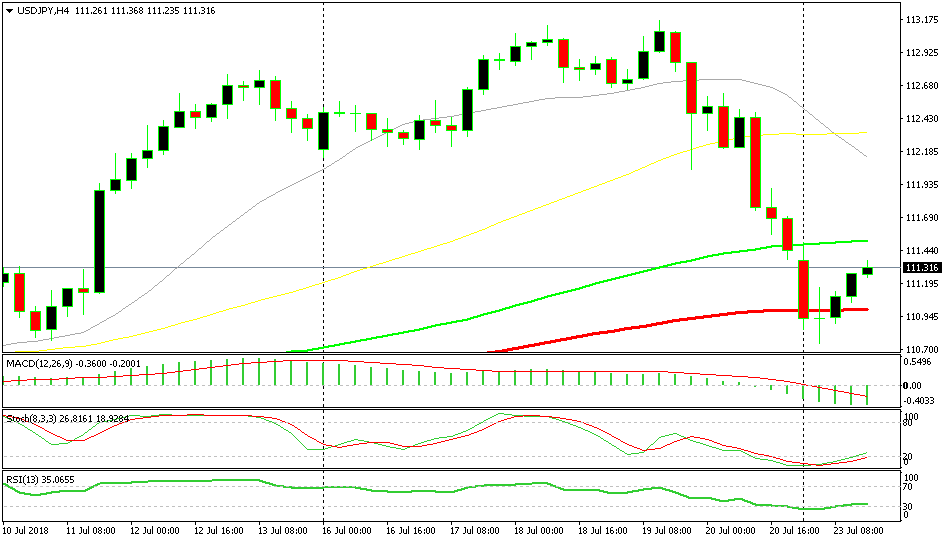
Three bullish candlesticks followed the doji
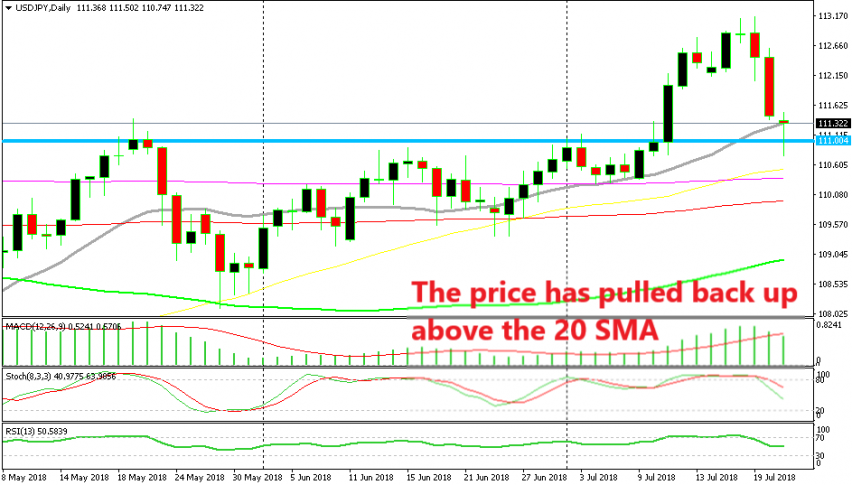
The Daily Time-Frame Chart
On the daily time-frame chart we see that stochastic is not oversold yet. So, this chart is not oversold but there are a few signs that point to a possible reversal. The first in this time-frame chart is the support line. Actually, it used to be a resistance line, but now that it has been broken it has turned into support.
Another bullish sign on the daily chart is the 20 SMA (grey). The price slipped below the 290 SMA this morning. But it has pulled back up now and if it closes above then it is probable that USD/JPY traders will see consider this moving average as another support indicator. These are self fulfilling indicators, so don’t be too surprised when traders change from short to long in a short period and vice versa.
The daily candlestick in itself is yet another bullish signal. If today’s candlestick closes as it is now, then it will form a doji. If the price closes higher, then it will form a hammer. Both are reversing signals after a retrace. So, we have three bullish signals on the H4 chart and three bullish signals on the daily chart. Although, if you want to go long, I would suggest that you wait until the day is over to see if the daily candlestick closes bullish and whether the 20 SMA (green) holds it ground.
- Check out our free forex signals
- Follow the top economic events on FX Leaders economic calendar
- Trade better, discover more Forex Trading Strategies
- Open a FREE Trading Account
- Read our latest reviews on: Avatrade, Exness, HFM and XM
Related Articles

Sidebar rates
Related Posts
