The Bullish Trend Is Still on for USD/CAD
USD/CAD made a reversal lower toward the end of last week, but it remains bullish on the daily chart as lows keep getting higher
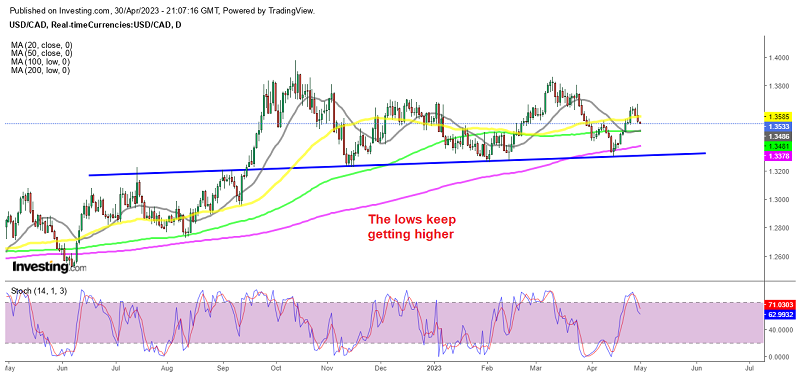
The USD has been showing considerable weakness since October, as the FED has slowed down with rate hikes and prepares to stop after the last hike on Wednesday, worth 25 basis points (bps). The UYSD has been retreating against most major currencies, although it remains bullish against the CAD.
USD/CAD was retreating during most of March, which lasted until the middle of April, but the 200 SMA (purple) held as support on the daily chart. The price reversed and pushed higher since then. Although, this pair remained relatively unchanged last week despite the volatility in foreign exchange markets. USD/CAD fluctuated up and down, with the high at around 1.3668.
We saw a decent bullish move higher during the first part of last week as crude Oil was slipping lower, but then this pair reversed back down as Oil turned bullish in the last two days. This lack of clear direction may be due to market uncertainty following the mixed figures from the USD last week, which saw USD/CAD appreciate by almost 2.6% in less than 10 trading sessions and then give the gains back.
Given the fragile market sentiment and growing concerns about a potential recession, high-risk currencies may underperform in the short term, which could create a negative environment for the Canadian dollar. In this context, USD/CAD may continue to rise in the coming weeks.
To confirm a bullish scenario, USD/CAD needs to break through the confluence resistance at 1.3645, a significant technical barrier where short-term trendline resistance aligns with the 61.8% Fibonacci retracement of the March/April pullback. If buyers manage to breach this ceiling, they may be encouraged to target the 1.3700 level and beyond.
However, if USD/CAD is rejected from current levels and bears take control of price action, the first support level to watch is 1.3580, corresponding to the 50-day simple moving average. If this support level is broken, the next downside target is likely to be near the psychological level of 1.3500.
USD/CAD Live Chart
- Check out our free forex signals
- Follow the top economic events on FX Leaders economic calendar
- Trade better, discover more Forex Trading Strategies
- Open a FREE Trading Account
- Read our latest reviews on: Avatrade, Exness, HFM and XM
Related Articles


Sidebar rates
Related Posts
