Oil Slides Toward $65 as OPEC+ Adds 548K Barrels—WTI Bulls Eye $68 Rebound
WTI crude oil prices fell more than 1% on Monday, extending last week’s decline as traders reacted to OPEC+’s surprise decision to increase.
Quick overview
- WTI crude oil prices fell over 1% as OPEC+ announced an unexpected production increase to 548,000 barrels per day for August.
- Concerns about demand are rising due to softer Chinese services activity and increasing US crude inventories, alongside new tariffs confirmed by President Trump.
- Technically, WTI is attempting to maintain support above $66, with potential for a bullish rally if it holds this level.
- Traders are advised to watch for bullish signals around the $66.00 zone, with specific entry and stop-loss levels outlined for potential trades.
WTI crude oil prices fell more than 1% on Monday, extending last week’s decline as traders reacted to OPEC+’s surprise decision to increase production. The group will now raise output by 548,000 barrels per day in August, up from the previously expected 411,000 bpd.
OPEC+ cited steady global growth and low oil inventories. But markets saw it differently—more supply, especially with softening demand, is bad for prices.
On the demand side, red flags are popping up. Chinese services activity was softer than expected, US crude inventories rose last week—the biggest increase in three months. And President Trump confirmed new tariffs will go live on August 1. Commerce Secretary Lutnick said the final rate is still being negotiated. This uncertainty adds to concerns about a demand drag.
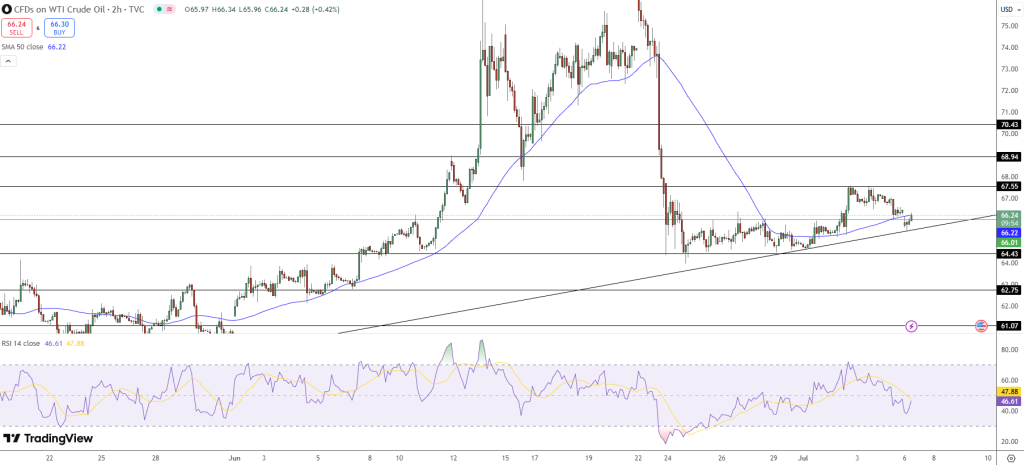
Price Action: Trendline Holds Above $66
From a technical standpoint, WTI crude (USOIL) is trying to hold its ground after testing the key ascending trendline that has been in play since mid-June. Prices bounced off the $66.00 zone, which also lines up with the 50-period simple moving average (SMA) on the 2-hour chart—a popular area for dip buyers.
A clean rejection from $67.55 last week triggered the latest decline, marked by a bearish engulfing candle. But the price structure is holding a series of higher lows, so bulls haven’t fully given up.
The Relative Strength Index (RSI) is around 46 and is trying to bottom out, showing early signs of bullish divergence. If a hammer or bullish engulfing candle forms above $66, it could spark a new rally.
Crude Oil Trade Setup: Can Bulls Get Back to $68?
Traders looking for a bounce have a clean setup here, but only if price holds above $66.00. A bounce from this zone with bullish candles could open up a short-term rally to resistance.
Bullish Rebound Setup:
- Entry Zone: $66.00–$66.20 (trendline confluence)
- Stop Loss: Below $64.40 (trendline breakdown + swing low)
- Target 1: $67.55 (minor resistance)
- Target 2: $68.94 (major supply zone)
If price breaks $64.40 though, it’s bearish in a hurry—$62.75 and $61.07 back in play. But for now, as long as the trendline holds, bulls are still in the game.
- Check out our free forex signals
- Follow the top economic events on FX Leaders economic calendar
- Trade better, discover more Forex Trading Strategies
- Open a FREE Trading Account
- Read our latest reviews on: Avatrade, Exness, HFM and XM
Related Articles


Sidebar rates
Related Posts
