Tesla (TSLA) Stock Surges 30% After Golden Ratio Rebound — What’s Next?

Quick overview
- Tesla stock has rebounded over 30% after finding support at the Fibonacci Golden Ratio level.
- A golden crossover on the daily chart indicates potential short- to medium-term bullish momentum, but a correction remains in place.
- Despite recent gains, Tesla must break above the key resistance at $390 to confirm a broader trend reversal.
- The mixed signals across various timeframes suggest caution, as the stock remains in a year-to-date downtrend.
Tesla stock has staged an impressive rebound, surging over 30% in just a few days after finding support at the critical Golden Ratio level. With momentum accelerating, the key question now is whether Tesla can sustain its upward trajectory — or if a near-term pullback is on the horizon.
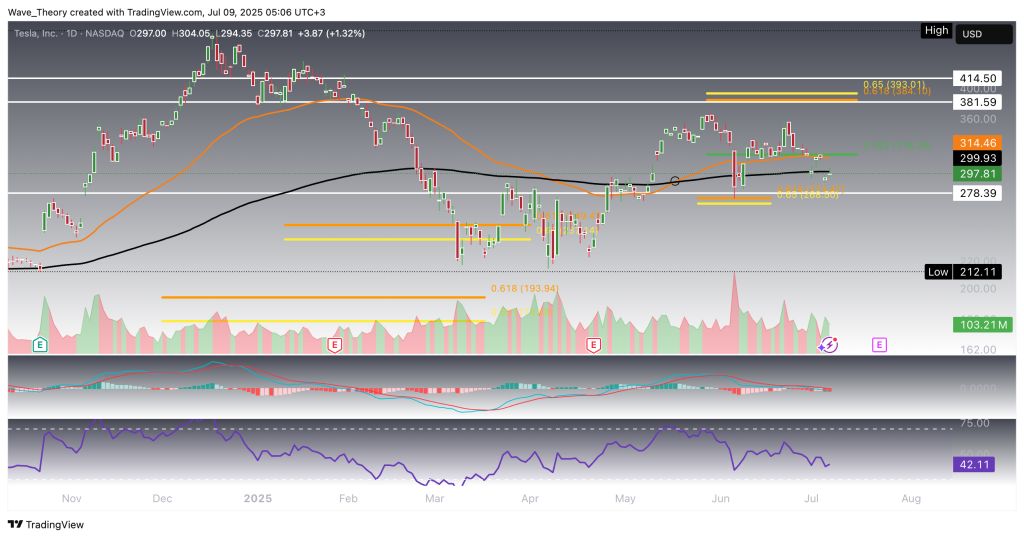
Tesla Forms Golden Crossover on the Daily Chart — But Correction Remains Intact
Tesla (TSLA) has now formed a golden crossover on the daily chart, with the 50-day moving average crossing above the 200-day moving average — a classic bullish signal that typically confirms trend strength in the short- to medium-term. This technical milestone follows a sharp rally from the recent low at $212, where TSLA surged to a local high of $368, coming within striking distance of the key resistance zone between $381.60 and $414.50. However, the stock failed to break through that resistance, instead initiating a corrective move that took it back down to the Fibonacci Golden Ratio support at $270.
At that level, Tesla bounced strongly, validating the support area. Yet despite the recovery, the price action has formed a lower high, falling short of retesting the aforementioned resistance zone — leaving the stock in a structurally intact corrective phase for now. Momentum indicators paint a mixed picture. The MACD lines remain in a bearish crossover, and the MACD histogram is ticking lower, reflecting ongoing downside momentum. Meanwhile, the RSI hovers in neutral territory, offering no decisive directional bias at this stage.
While the golden crossover suggests underlying strength, the current correction pattern and bearish momentum indicators warrant caution until Tesla decisively breaks above resistance.
Tesla
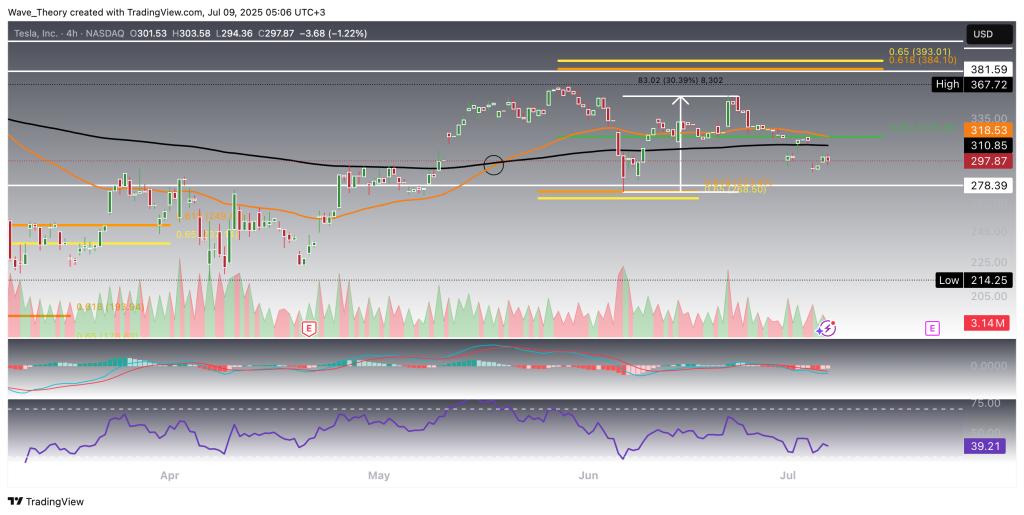
Tesla Stock Shows Mixed Signals on the 4H Chart
The 4-hour chart for Tesla (TSLA) presents a technically mixed outlook. The exponential moving averages (EMAs) have recently formed a golden crossover, signaling short-term bullish momentum. However, that crossover is now at risk of being invalidated, as the EMAs appear to be converging — potentially setting up for a bearish crossover (death cross) if downside pressure continues.
At the same time, the MACD lines have already crossed bearishly, reinforcing near-term weakness. The RSI is trading in neutral territory but is gradually approaching the oversold zone, which could imply a potential short-term bounce if selling pressure persists.
Interestingly, the MACD histogram stands as the lone bullish component, having been ticking higher in recent sessions — a subtle indication that bearish momentum may be weakening.
Overall, Tesla’s 4H chart reflects a tug-of-war between weakening bearish momentum and tentative bullish structure, with price action at a technical inflection point.
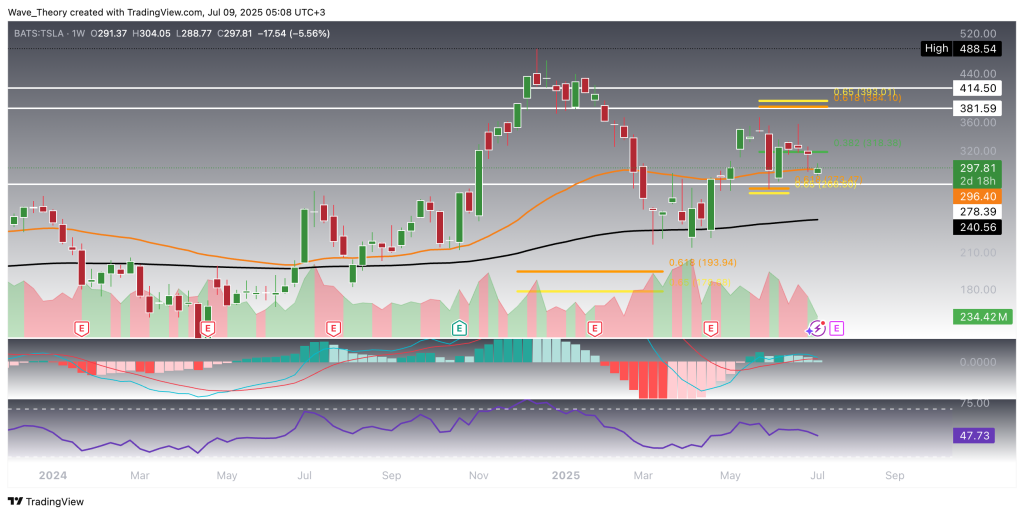
Tesla Stock YTD Trend Remains Bearish — Key Resistance Still Intact
Zooming out to the broader picture, Tesla (TSLA) remains in a year-to-date downtrend, with the current price structure still reflecting an unresolved corrective phase. While the stock finds strong support at the Fibonacci Golden Ratio level around $190, it has so far held above the 200-week EMA at $240, from which it staged a notable rebound.
Despite this strong upward movement, the larger correction remains technically valid, as TSLA has yet to break above the critical Golden Ratio resistance at $390. Only a decisive breakout above this level would invalidate the ongoing correction and open the path toward retesting the all-time high at $488.50.
On the weekly chart, indicators offer a mixed outlook. The EMAs continue to display a golden crossover, suggesting a bullish mid-term bias. However, downside momentum appears to be building, with the MACD lines nearing a bearish crossover and the MACD histogram printing lower for three consecutive weeks. Meanwhile, the RSI remains neutral, providing no clear directional signal at this stage.
In summary, while Tesla has shown resilience off major support zones, the stock must overcome key resistance at $390 to confirm a broader trend reversal. Until then, the YTD bearish structure remains technically intact.
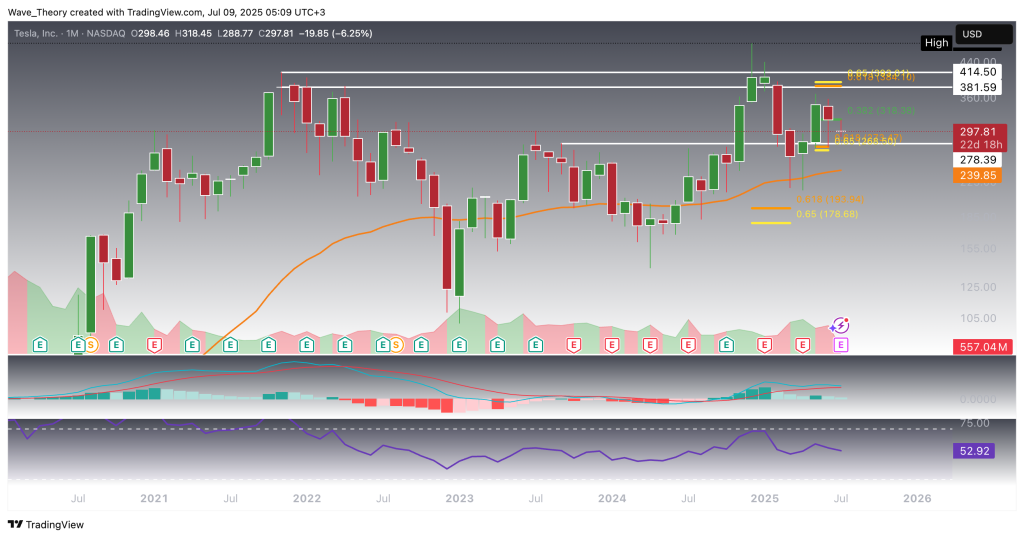
Tesla Stock Shows Similar Outlook on the Monthly Chart
The monthly chart for Tesla (TSLA) mirrors the broader correctional structure observed across lower timeframes. The MACD histogram has been ticking bearishly lower since last month, and the MACD lines are approaching a potential bearish crossover, signaling weakening momentum on a higher timeframe. Meanwhile, the RSI hovers in neutral territory, offering no clear directional bias at this stage.
Key support levels to monitor are found at $270, $240, and the critical Golden Ratio level at $190. On the upside, $318 and $390 serve as important resistance levels, with the latter marking the key Fibonacci level that must be broken to invalidate the ongoing correction.
As long as Tesla holds above $190, the longer-term bullish structure remains technically viable. However, the correction remains bearishly intact until TSLA decisively breaks above the Golden Ratio resistance at $390. Until then, the price action continues to reflect a consolidation within a broader downtrend.
- Check out our free forex signals
- Follow the top economic events on FX Leaders economic calendar
- Trade better, discover more Forex Trading Strategies
- Open a FREE Trading Account
- Read our latest reviews on: Avatrade, Exness, HFM and XM
Related Articles


Sidebar rates
Related Posts
