Dogecoin Drops to $0.20 as 310M Tokens Accumulated by Institutions
DOGE is trading at $0.20, down 1.83% in the last 24 hours after an 8% correction from recent highs. But rather than a mass exodus...
Quick overview
- DOGE is currently trading at $0.20, down 1.83% in the last 24 hours, but institutional wallets have purchased 310 million DOGE during this pullback.
- The RSI is at 42.54, indicating oversold conditions that could trigger a short-term bounce.
- Despite recent price drops, DOGE had a strong July with a 17.54% increase, driven by rising business usage and social media attention.
- Traders should monitor the support at $0.19 and resistance at $0.29, with conservative investors advised to wait for a close above $0.22 before entering.
DOGE is trading at $0.20, down 1.83% in the last 24 hours after an 8% correction from recent highs. But rather than a mass exodus, it seems to have triggered buying. Institutional wallets bought 310 million DOGE during the pullback, so the smart money is confident.
This buying came as DOGE volume surged to 1.25 billion tokens, so the market is definitely interested. Dogecoin’s RSI is at 42.54, which is oversold territory. Historically this has been a short term bounce trigger.
Despite the drop, DOGE had a great July, up 17.54% as Bitcoin went past $120,000. DOGE also went up 15% on July 26 as business usage and social media attention picked up, including a nod from Elon Musk. But recent price action suggests consolidation rather than clear bullish continuation.
Mixed Signals
DOGE’s technicals are mixed.
- RSI 42.54, could bounce
- MACD Histogram -0.0068, bearish but shallow
- Bollinger Band Width DOGE at 0.1943, near lower band
- 7-Day SMA $0.22, above current price
- 20-Day SMA $0.23, above current price
- 50-Day SMA $0.19, support
DOGE is near the lower Bollinger Band so could bounce, especially with the 50-day SMA at $0.19 as support. Below that and it could get ugly, possibly down to the 52-week low of $0.14.
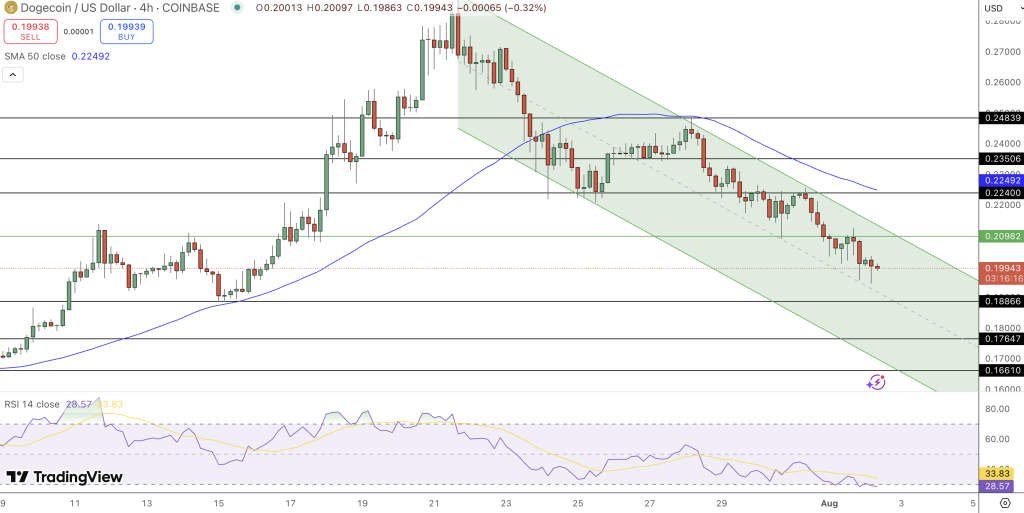
Above that and DOGE faces resistance at $0.29, a big psychological and technical barrier. Above that and it’s a 45% move from here.DOGE is a buy or wait situation. High risk traders can enter at $0.20 with stop at $0.19 and target $0.22, the 7-day SMA. 1:1 risk reward setup for short term.
Key points:
- Support: $0.19
- Resistance: $0.29
- ATR (Volatility): $0.02 or 10% of current price
Conservative investors may want to wait for a close above $0.22 with volume before entering. DOGE is range bound between $0.19-$0.22 so swing traders should watch volume and price action at these levels.
- Check out our free forex signals
- Follow the top economic events on FX Leaders economic calendar
- Trade better, discover more Forex Trading Strategies
- Open a FREE Trading Account
- Read our latest reviews on: Avatrade, Exness, HFM and XM
Related Articles


Sidebar rates
Related Posts
