Gold Faces Breakout Test: Dollar Surge Sets Stage for Powell at Jackson Hole
Gold prices slipped Friday as the U.S. dollar strengthened, with investors awaiting Federal Reserve Chair Jerome Powell’s...

Quick overview
- Gold prices fell as the U.S. dollar strengthened, with investors awaiting comments from Fed Chair Jerome Powell.
- Futures markets indicate a 75% chance of a quarter-point rate cut, but Fed officials show reluctance to support this in September.
- Geopolitical tensions, particularly regarding Russia and Ukraine, add uncertainty to the market, impacting gold's safe-haven appeal.
- Technical analysis suggests gold is consolidating within a symmetrical triangle, with key support and resistance levels identified.
Gold prices slipped Friday as the U.S. dollar strengthened, with investors awaiting Federal Reserve Chair Jerome Powell’s remarks at the Jackson Hole Symposium. The U.S. Dollar Index hovered near a two-week high, reducing gold’s appeal for overseas buyers.
Fed officials appeared reluctant to support a September rate cut, leaving markets cautious. Futures markets currently price a 75% chance of a quarter-point cut, according to CME’s FedWatch tool. Recent labor data, showing the biggest jump in U.S. jobless claims in three months, highlights the challenge: slowing growth but still-stubborn inflation.
Geopolitical Tensions Add to Uncertainty
Markets are also watching developments abroad. Russian President Vladimir Putin’s demands on Ukraine—including renouncing NATO ambitions and ceding the Donbas region—have added a geopolitical layer to market risk. Although peace efforts are discussed, uncertainty remains, limiting gold’s safe-haven traction.
Tim Waterer, chief market analyst at KCM Trade, said: “With a Russia-Ukraine peace deal still a possibility, and the USD attracting buyers, gold is facing headwinds. But if Powell signals a dovish shift, the dollar could lose ground and gold may rebound.”
Gold Price Outlook: Technical Set-Up
On the charts, gold (XAU/USD) is consolidating inside a symmetrical triangle, a formation often signaling a breakout. Support holds near $3,312 while resistance remains capped at the 50-day SMA around $3,341.
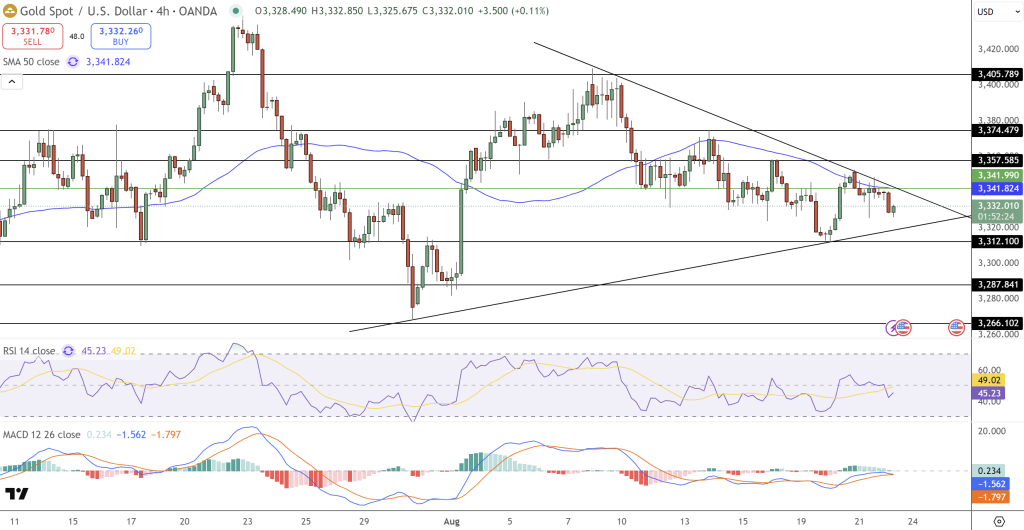
- RSI: Hovering near 45, showing weak momentum.
- MACD: Negative but flattening, hinting at easing downside pressure.
- Candles: Recent Doji formations reflect market indecision.
Trade Setup: A breakout above $3,358 could target $3,374 and $3,405, while a close below $3,312 risks a slide toward $3,288 and $3,266. Traders may prefer to wait for a daily close outside the triangle before committing positions.
- Check out our free forex signals
- Follow the top economic events on FX Leaders economic calendar
- Trade better, discover more Forex Trading Strategies
- Open a FREE Trading Account
- Read our latest reviews on: Avatrade, Exness, HFM and XM
Related Articles


Sidebar rates
Related Posts
