Gold Price Forecast: $3,378 Breakout in Focus as Powell Fuels Rate Cut Bets
Gold dipped on Monday, pulling back from near two week highs as the dollar strengthened. The US dollar index rose 0.2%...
Quick overview
- Gold prices dipped on Monday as the dollar strengthened, pulling back from near two-week highs.
- Fed Chair Jerome Powell's dovish comments suggest a potential rate cut, which could support gold prices.
- Technical analysis shows a bullish breakout attempt for gold, with key resistance at $3,378.
- Traders are advised to wait for a close above $3,378 before going long, with specific stop-loss and target levels outlined.
Gold dipped on Monday, pulling back from near two week highs as the dollar strengthened. The US dollar index rose 0.2% after hitting a four week low, making gold more expensive for overseas buyers. But Fed Chair Jerome Powell’s dovish comments last week provided a cushion.
Powell hinted at a rate cut at the September 17th meeting, saying job market risks are rising even as inflation pressures persist. Futures are now pricing in 87% chance of a quarter point cut and 50 basis points of easing by year end. Lower rates generally support gold by reducing the opportunity cost of holding non-yielding assets.
Investors are also watching Friday’s US PCE inflation data, expected to show core prices up 2.9% year on year – the highest since late 2023. Lower numbers could give gold another leg higher.
Gold Technicals: Bullish Breakout Attempt
On the 2 hour chart, gold has broken out of a contracting wedge, reclaiming $3,351 resistance and consolidating around $3,368. A bullish engulfing candle confirmed the breakout, after weeks of sideways action.
#GOLD reversed higher after Powell's speech and remains within a bullish structure. pic.twitter.com/zIKg4jdZRM
— Gold Predictors (@GoldPredictors) August 24, 2025
The 50 period SMA at $3,339 has turned into support, while momentum indicators are bullish. RSI is at 63, not overbought and MACD has given a bullish crossover with widening histogram bars. Long lower wicks at $3,313 show buyers stepping in on dips.
Gold Key Levels and Trade
The real test is at $3,378, a level that has capped rallies multiple times. A close above this would clear the way to $3,405 and $3,433, in line with TradingView’s breakout path. Failure to hold $3,351 could drag gold back to $3,339 and possibly $3,313.
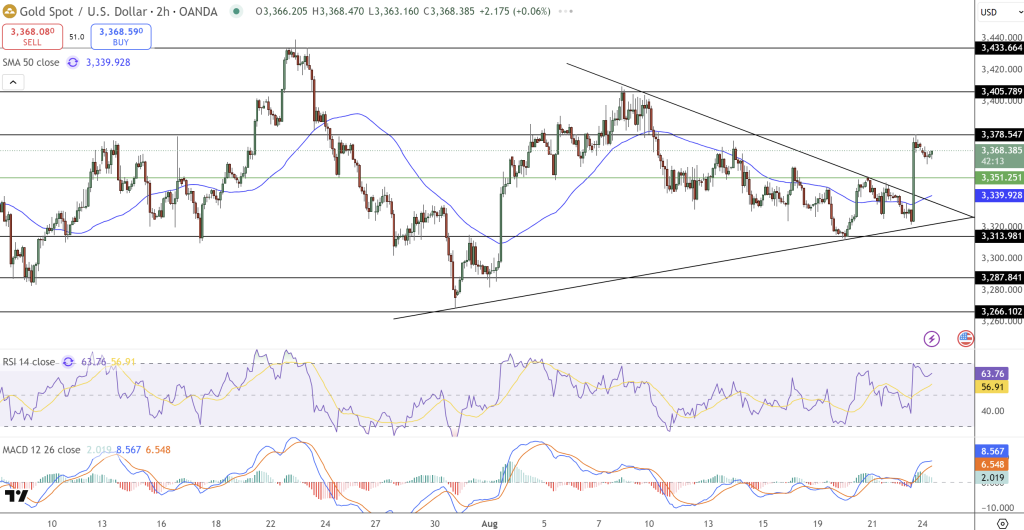
For new traders, the trade is clear: wait for a close above $3,378 before going long. Stops can be placed below $3,339 to manage risk, and targets go to $3,405 and $3,433. If momentum carries through, this could set gold up for a bigger move – and solidify its role as a safe haven in a crazy macro world.
- Check out our free forex signals
- Follow the top economic events on FX Leaders economic calendar
- Trade better, discover more Forex Trading Strategies
- Open a FREE Trading Account
- Read our latest reviews on: Avatrade, Exness, HFM and XM
Related Articles


Sidebar rates
Related Posts
