Gold Price Forecast: $3,433 in Sight as Triangle Breakout Fuels Rally
Gold is back in motion after weeks of sideways trading, breaking out of a descending triangle on the 4-hour chart.
Quick overview
- Gold has broken out of a descending triangle, indicating a bullish trend with support at $3,344.
- Recent candle action shows strong demand, with a bullish engulfing candle pushing prices to $3,385, the first resistance zone.
- Technical indicators like RSI and MACD suggest building momentum, supporting the potential for further upside.
- Key levels to watch include support at $3,344 and resistance at $3,385, with a daily close above $3,385 opening the door to higher targets.
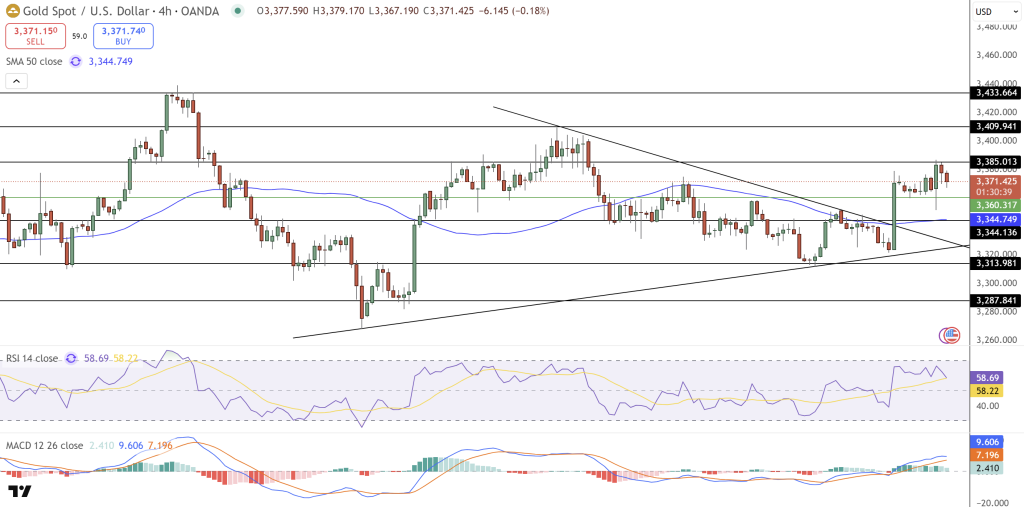
Gold is back in motion after weeks of sideways trading, breaking out of a descending triangle on the 4-hour chart. This is bullish, with price above the 50-day SMA at $3,344 which is now support. For traders this is a big deal – buyers are stepping back in and the bigger trend remains intact despite the volatility.
Candle action supports this view. A bullish engulfing candle cleared the $3,360 pivot, then sustained buying took gold to $3,385. This is the first resistance zone, and long lower wicks in recent sessions show demand is still strong on dips.
Gold Momentum Means More Up
Technicals agree. RSI is at 58, not overbought yet, and MACD has crossed above zero with widening bars – all signs of building momentum. Gold has also been making higher lows since mid-August, a constructive pattern that supports more upside.
Key levels to watch:
- Support: $3,344 and $3,313
- Resistance zones: $3,385, $3,410 and $3,433
- Upside trigger: A daily close above $3,385 opens the door to higher targets.
Gold Trade Setup and Price Outlook
For new traders the setup is simple. If gold closes above $3,385 momentum could take it to $3,410 and $3,433 short term. Below $3,344 it could retest $3,313, but long lower wicks show dip buyers are still active.
A strong reversal signal – like another engulfing candle or three white soldiers – would strengthen the case for a bigger rally. If momentum holds $3,433 is the next upside target.
In short, gold is back in motion. With technicals aligned and demand on every dip, it may be setting up for the next leg higher.
- Check out our free forex signals
- Follow the top economic events on FX Leaders economic calendar
- Trade better, discover more Forex Trading Strategies
- Open a FREE Trading Account
- Read our latest reviews on: Avatrade, Exness, HFM and XM
Related Articles


Sidebar rates
Related Posts
