JSE Top 40 Slips Below 93,900 as Momentum Fades: Key Levels to Watch
JSE Top 40 Index slips to 93,893.5, down 145 points (-0.15%) as it fails to hold above 94,900 resistance zone...

Quick overview
- The JSE Top 40 Index closed at 93,893.5, down 145 points (-0.15%), failing to maintain above the 94,900 resistance level.
- Investor sentiment remains cautious as the market awaits clarity on upcoming US and South African economic data.
- The rand traded steadily while the SA 2035 bond yield dipped slightly, indicating stable demand in fixed income.
- Technical indicators suggest a bearish outlook for the index, with key support levels being tested ahead of critical data releases.
JSE Top 40 Index slips to 93,893.5, down 145 points (-0.15%) as it fails to hold above 94,900 resistance zone
The market is tired of balancing global uncertainty with local economic worries. Investor sentiment is cautious and waiting for clarity on US and SA data. In the US, the PCE Price Index (Fed’s preferred inflation gauge) is due later this week and could shift rate-cut expectations. Locally, credit growth, trade balance and budget data will guide the market.
- Index close: 93,893.5
- Daily move: -145 points (-0.15%)
- Investor tone: cautious
Rand and Bonds Trade Steady
The rand traded quietly in early sessions, following global currencies as the dollar was flat against its peers. With markets pricing in a September rate cut, the rand will remain range-bound until US inflation data is clearer.
SA 2035 bond yield dipped by 1 basis point to 9.595%, indicating cautious but stable demand in fixed income. Limited volatility in bonds and rand shows investors are waiting and seeing.
- Rand: quiet
- Bond yield: 9.595%
- Drivers: US inflation expectations, local data releases
JSE Top 40 Index Technical Outlook: Key Levels Ahead
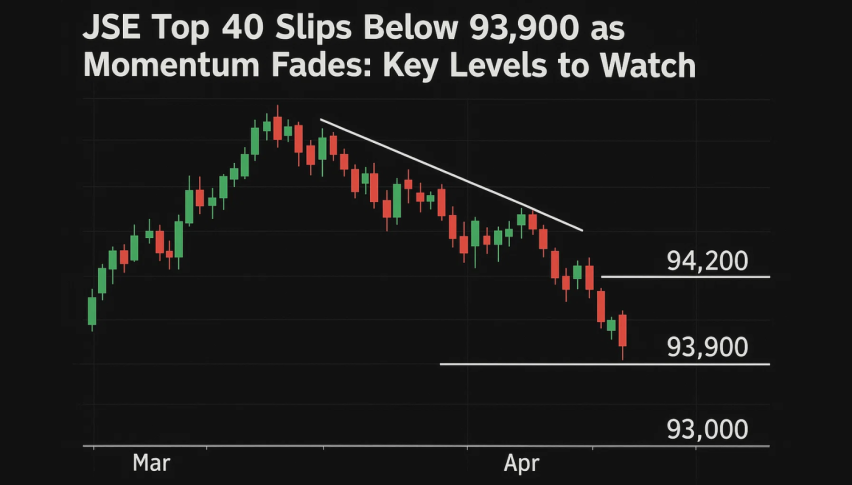
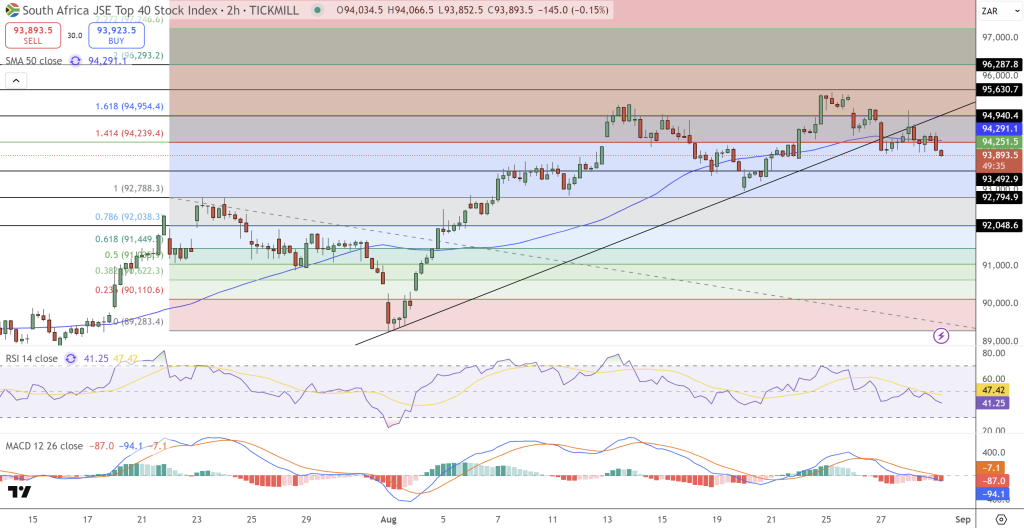
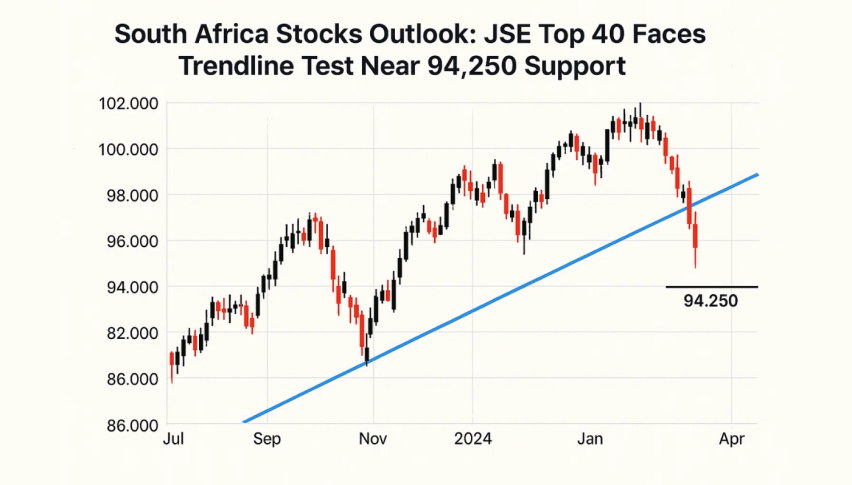
From a technical perspective, the JSE Top 40 is losing steam. The index has broken below a short-term trendline, with candles showing long upper wicks and small bodies – clear signs of rejection at resistance.
The 50-SMA at 94,291 has flattened, while current levels are near the 0.786 Fibonacci retracement at 93,492. A break below this level could see the index go deeper to 92,794, then 92,048. Momentum indicators support this view:

- RSI at 41 is heading towards oversold.
- MACD is negative and weakening.
For traders, confirmation is key:
- Bearish setup: Short below 93,490, target 92,794-92,048, stop above 94,300.* Long only above 94,291 to 94,940-95,630, stop below 93,400.
Summary
The JSE Top 40 is at a junction. Momentum is waning and key support is being tested. The next move will be driven by US inflation data and local data. Until then, investors are cautious, the index is bearish unless buyers step in.
- Check out our free forex signals
- Follow the top economic events on FX Leaders economic calendar
- Trade better, discover more Forex Trading Strategies
- Open a FREE Trading Account


