The market for copper is the third largest of all metals, behind iron and aluminum. The global market size of copper is valued at $ 261 Billion. Copper plays a vital role in global industrial production, and copper wire greatly impacts the telecom industry.
Copper is extracted from large open mines in West Africa, Europe, the Middle East, China and Central and South America. The demand for copper from China and India has been playing a dominant role in raising the prices for this metal in recent years. Chile and the United States have large copper reserves, which it is estimated will be depleted over the next 50 years. But, given the current demand, the copper reserves are likely to be depleted even earlier, in about 25 years.
The futures contracts of copper are traded with the LME in NYMEX, and they have the third largest trading volume after iron and aluminum. The factors that have an impact on copper prices include global economic growth, mining production, exploration of new mines, earthquakes, shipping problems, political unrest in Chile, Peru and South Africa, increased or decreased consumption of major nations like China, the US and the EU, inventory stocks in LME & NYMEX and the copper supply reports, including high-grade warehouse stocks.
Copper – Historical Price Charts:
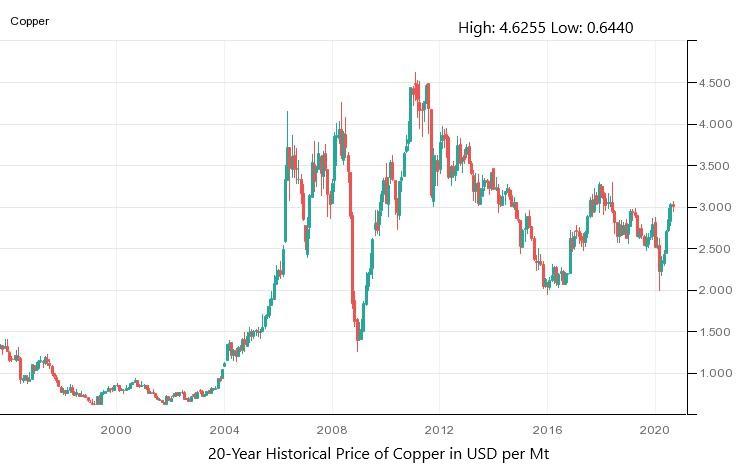
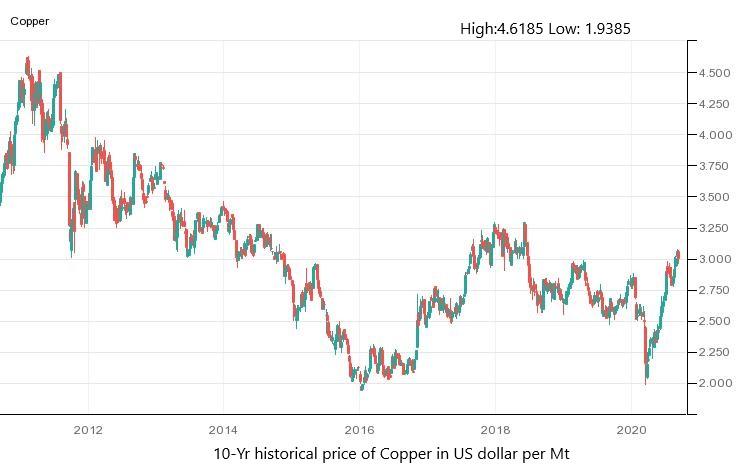
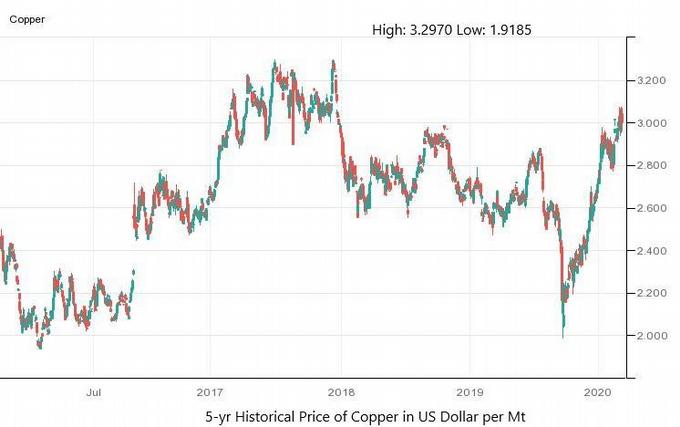
Why Look at Historic Copper Prices?
Copper is commonly used as an indicator of global economic health, due to its wide range of uses. There are manifold factors involved in the determination of a bullish bias in copper. Let’s explore them one by one, in order to forecast the copper prices.
Coronavirus Pandemic:
Copper prices left 2019 behind with expectations of a positive performance in 2020, due to the potential resolution of the US-China trade conflict, that had been impacting global economic growth in previous months. The industry experts and executives anticipated a bullish trend for copper in 2020, as they had predicted a surge in large infrastructure projects across the world.
Copper prices were hard hit in 2019, as a result of President Trump’s severe measures against China, which led to the trade war between the US and China. This move ended up halting the global economic growth, which is another factor that impacts on copper prices.
However, the copper price had recovered by the end of the year, as the hopes for a settlement started to emerge in the market, raising expectations for significant recovery.
Nonetheless, a sharp decline in commodity prices started to hit the market on January 15, after the emergence of the contagious virus in Wuhan, China. This raised concerns, as lockdown restrictions, which affected economic activities in industrial production, began to be imposed all over the globe.
The copper prices were stable for most of February, until the World Health Organization finally declared a global pandemic. As a result, the copper prices fell by 19%, to $ 2.10, which is the lowest level for the year, to date.
Global Economic Downturn:
The price of copper is often used as a benchmark for gauging the health of the global economy. The two are directly related, which means that if the global economy is in a period of sustained growth, the price of copper is usually high, as, at such times, the industrial demand for the metal is also high. On the other hand, in periods of economic downturn, the price of copper is low, due to low levels of spending on infrastructure growth.
In the first quarter of 2020, the global GDP reduced at an annual rate of 4.8%, while the 4th quarter of 2019 reported a 2.1% increase in global GDP. The economy was already disrupted, due to the ongoing US-China trade war. Then the coronavirus pandemic added to the pressure, causing a sudden decline in the global GDP.
Speculating on the prices of copper can provide a trend for world growth or GDP. The copper prices fell by 21.13% in the first quarter of 2020, suggesting a bearish view on world growth in the same period.
Reduced demand from major markets:
The countries with rapid development are the main contributors to the copper market, as their demand for copper increases, due to extensive spending on transport infrastructure and housing developments. As a result, emerging markets, like China, Brazil and India have a large share in the global copper demand. After the coronavirus outbreak in Wuhan, China was forced to shut down all industrial activities in February and March 2020.
In March, China’s industrial production declined significantly, by 13.5%; this weighed on the demand for copper.
The spread of the coronavirus across the world forced all other countries to halt all economic activities by the end of March. This also resulted in a decline in metal consumption in Europe and the United States; the continuous decline led to stockpiling.
In Q1 2020, the copper inventories in Shanghai warehouses and metal exchanges surged by about 46%, to 955,000 Mt. Meanwhile, the refined copper inventories in the major global exchanges also increased by 50%, as per data released by the Chilean Copper Commission. These raised inventories, due to lower demand, as a result of the economic shutdown, added to the declining copper prices in the first quarter of 2020.
Supply constraints:
The lockdown across the world, to prevent the spread of the coronavirus, halted mining activities for copper and other metals, causing delays in several projects. The biggest copper mining facility in Chile, Codelco, also reduced its operational activities, due to the government’s state of emergency orders. The mines in Chile and Peru, which together account for nearly 40% of the global production, remained closed for about 15 days. In some other countries, like the Democratic Republic of Congo, Mexico and Zambia, mining production was also suspended. This halted the supply of copper to manage the increasing number of stockpiles.
However, the decline in the demand for copper, amid the lockdown restrictions and rising fears of a global recession, outweighed the supply constraints and pushed the copper prices to their lowest level in three years.
Prices Reversed to Bullish Bias
When China’s lockdown was lifted on March 24, after 76 days, the copper prices jumped by almost 76%, since the trade was reversed, even though prices had accumulated a 19.3% decline. The surge in copper prices was due to China reopening the markets and other countries that raised hopes for economic recovery.
Government stimulus packages, combined with the news of the lifting of restrictions, gave the copper prices a boost in April. As the rest of the world remained locked down in April, the continued supply constraints pushed the copper prices onto the upside.
As most counties reopened their economies in May, the anticipated improvement in demand kept the prices high in May.