Crude Oil Historical Price Charts – WTI Price History
Last Update: March 28th, 2023
Crude Oil Price History: Recent updates (2023)
WTI crude futures were holding strong at around $73 per barrel on Tuesday, thanks to a legal dispute that put a stop to 400,000 barrels a day of oil exports from Turkey’s Ceyhan port. I mean, who knew a legal battle could have such a big impact on oil prices?
But that’s not all, folks! The banking sector is also giving us a reason to smile. Positive newsflow has raised hopes that we may finally be out of the woods when it comes to recent banking turmoil. And let’s not forget about China’s demand recovery and the Federal Reserve potentially calling off its tightening campaign. All of this is adding to the good vibes in the market.
However, it’s not all sunshine and rainbows. The US oil benchmark is still hovering near its lowest levels since December 2021, thanks to growing fears of a US recession and a stubbornly resilient Russian supply. JPMorgan Chase & Co. even predicts that Brent could dip below $60 per barrel in the near future.
So, it’s a mixed bag of news in the world of oil. But hey, at least we can count on legal disputes and banking sector drama to keep things interesting, right?
What is Crude Oil?
Crude oil, commonly known as petroleum, is a liquid found deep within the earth. It is composed of hydrocarbons, organic compounds and small amounts of metal. It is often referred to as “black gold”, as well the names US Oil, CL and WTI. Crude oil is one of the most highly demanded products in the world, and the rates for this commodity have risen significantly in recent times. Two main benchmarks for the pricing of crude oil are the United States’ WTI (West Texas Intermediate) and the United Kingdom’s Brent. The differences between WTI and Brent involve not only the price but also the type of oil. WTI produces crude oil with a different density and sulphur content. The demand for crude oil is dependent on both global economic conditions and market speculation. The common denomination for crude oil prices is the US dollar.
Current WTI Price: $
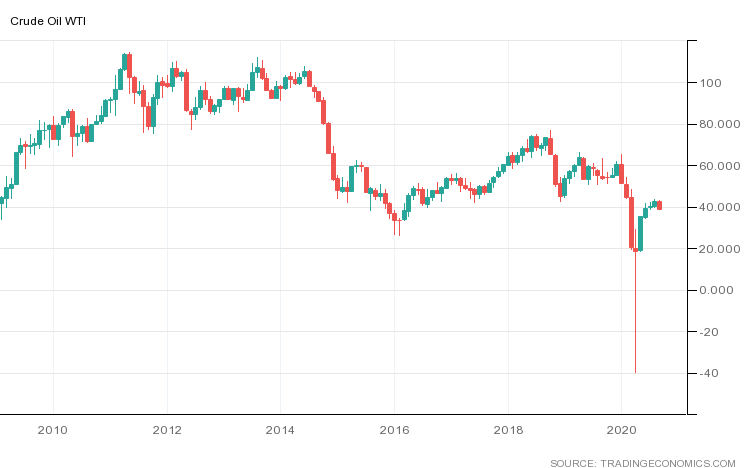
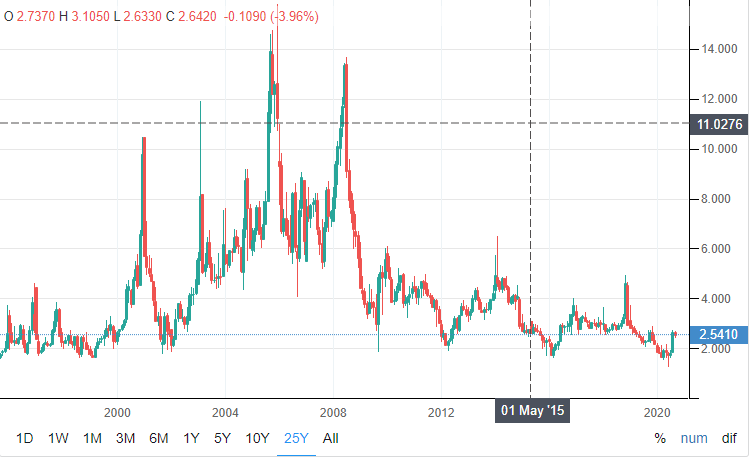
25-Year Chart
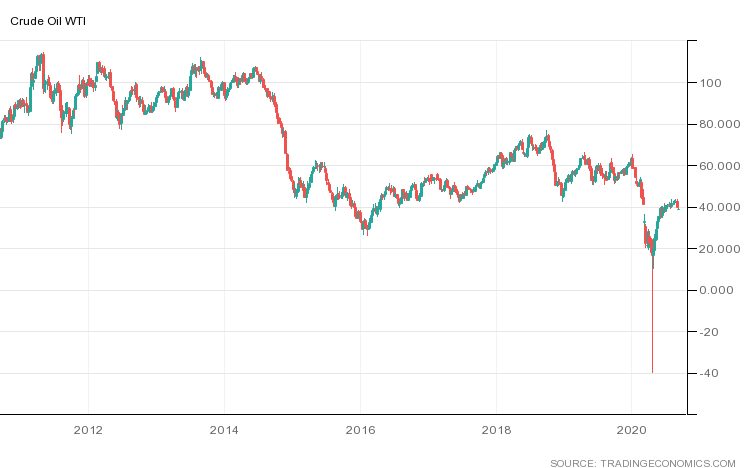
10-Year Chart
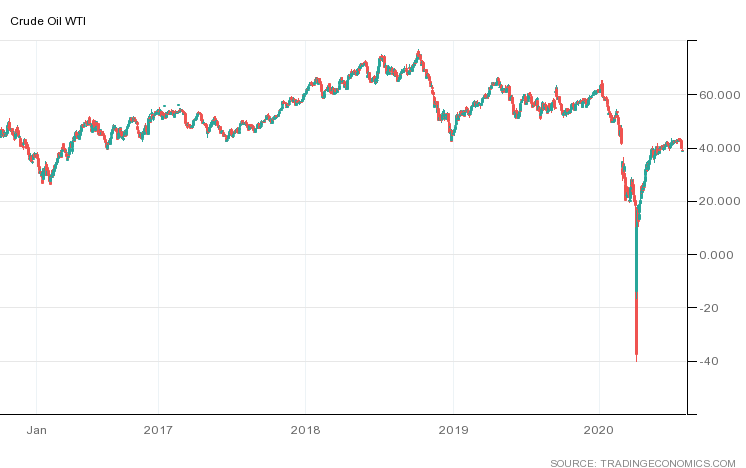
5-Year Chart
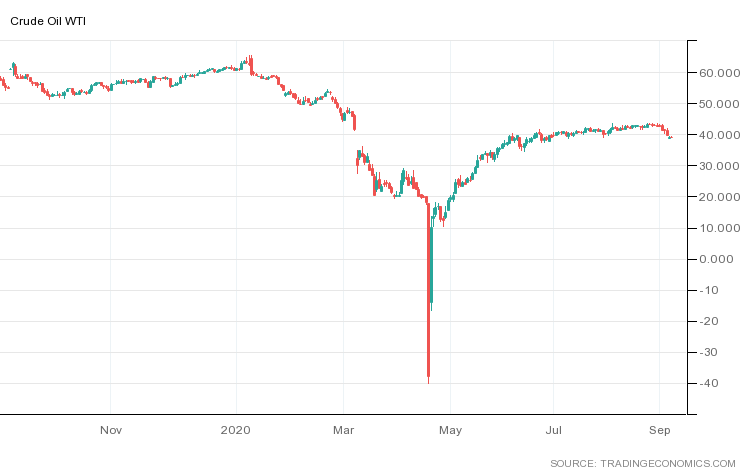
1-Year Chart
Similar Pairs
Natural Gas
Why Look at Historical WTI Crude Oil Prices?
There are manifold factors involved in the determination of a WTI crude oil price. Let’s explore them one by one, in order to forecast the USOIL price.
COVID-19 – Coronavirus Pandemic – The WTI Crude Oil prices dropped significantly in 2020, due to the COVID-19 pandemic, causing a massive drop in the stock market. As per the IHS Market report, the “COVID-19 demand shock” represented a larger contraction than that faced during the Great Recession in the late 2000s and the early 2010s. As a result, the oil demand dropped to 4.5m million barrels a day lower than the forecasts, as tensions escalated between OPEC members. During the OPEC meeting in Vienna (March 6), major oil producers were unable to come to an agreement regarding reduced oil production, in response to the global COVID-19 pandemic. Consequently, the spot price of WTI Benchmark Crude Oil on the NYM dropped to USD 42.10 per barrel.
Supply of Crude Oil – For several decades, the Organization of Petroleum Exporting Countries (OPEC) has played a significant role on the trading floors. Its oil-producing division nations operate collectively to ascertain that crude oil production is increased or reduced, based on the oil prices. The supply of crude oil is also defined by external factors, which might incorporate weather patterns, exploration and production (E&P) costs, investments and innovations. A drop in the supply of crude oil triggers a bullish trend in the US oil price. Conversely, increased crude oil stocks drive a selling bias in US Oil.
Demand of Crude Oil – Robust economic growth and industrial production serve to expand the oil demand – as revealed by the varying demand patterns by non-OECD countries, which have proliferated in recent years, due to the US Crude oil prices taking a bearish turn upon the dip in the demand of crude oil, amid worse-than-expected economic events, such as the GDP, labor market, manufacturing PMI and industrial production figures. Conversely, better-than-expected, economic events trigger the demand for US oil.


