HBAR/USD – Forecast Summary
| HBAR Forecast: Q1 2022 Price: $0.50 – $0.60 Price drivers: Cryptocurrency Market, Ethereum prices, Cryptocurrency crackdown |
HBAR Forecast: 1 Year Price: $1.00 – $1.50 Price drivers: Increased Adoption and Utility, Cryptocurrency Market, War on cryptos |
HBAR Forecast: 3 Years Price: $2 – $4 Price drivers: Global crypto politics, New Developments from NEO, Crypto Market Sentiment |
The native coin of Hedera Hashgraph, the HBAR, has been showing considerable strength in 2021. It initially surged from $0.030 in February, to $0.45 by March, which translates to an increase of 1,500% in value. Then, it surged again after the retreat in summer, making new highs up to $0.57. The price is trading off the highs, but the trend remains upward, and the buyers remain in control.
The Hashgraph technology is considered the next step after the blockchain technologies. It uses a “gossip” protocol technology to verify and validate transactions, instead of the proof-of-work or proof-of-stake, which are more power-consuming than the Hashgraph. Hedera Hashgraph is the only crypto network to employ this technology, which is supposed to be both cheaper and faster than the Layer 1 and Layer 2 blockchain networks.
Factors Affecting Hedera Hashgraph
Like most cryptocurrencies, HBAR is mostly affected by the sentiment in the crypto market, which caused it to surge earlier this year, retreat in summer and resume the bullish trend again in September, along with the majority of cryptocurrencies. The sentiment right now is affected by the fiat monetary system, which is cracking down on cryptocurrencies, and also by the way the public is reacting to it. After the panic and the crashes in the crypto market in May and September, the sentiment has stabilized, and it remains cautiously positive for cryptocurrencies, in general, as well as for HBAR. Besides that, Hedera is also responding to its own demand.
Recent Changes in the HBAR/USD Price
| Period | Change ($) | Change % |
| 30 Days | +0.04 | +11.8% |
| 3 Months | +0.22 | +137% |
| 6 Months | +0.02 | +1.1% |
| 1 Year | +0.35 | +1,260% |
| 2 Years | +0.15 | +253% |
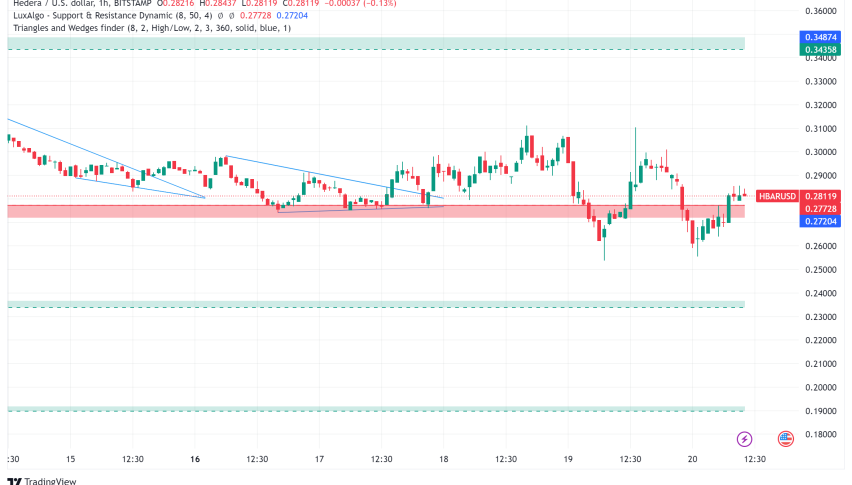
Hedera Hashgraph Live Chart
Hedera Hashgraph (HBAR) Price Prediction for the Next 5 Years
What is Hedera Hashgraph?
Hedera Hashgraph is an enterprise-grade network for the decentralized economy, which enables individuals and businesses to create powerful decentralized applications (Dapps). It is the authorized ledger of the Hashgraph distributed ledger technology, which could be considered an alternative to the blockchain technology. It is supposed to provide higher speeds, low costs and security than the blockchain technology. The Hashgraph technology aims to eliminate the limitations that older blockchain-based networks face, like slow performance and instability. Unlike the blockchain networks, the hashgraph algorithm does not use the mining process to validate transactions. Instead, this new technology uses the “gossip” protocol, in which the individual nodes on the “gossip” network about transactions to create directed acyclic graphs that time-sequence transactions without bundling them into blocks.
Hedera Hashgraph was funded by the American computer scientist, Leemon Baird, in August 2018, through an initial coin offering (ICO), and as part of the ICO, investors were able to buy the platform’s native utility coin, HBAR, at the lowest possible price. It first launched open access to its mainnet in September 2019. Hedera is owned and managed by a “governing council” of global companies and entities that have invested in it, such as Swirlds, Google, Boeing, IBM, etc. HBAR is mainly used as fuel to power smart contracts, and for file storage and regular transactions on Hedera. But, it is also used to help secure the network, with HBAR users staking their tokens to assist with maintaining the integrity of the platform.
HBAR is Following the Market Average
The crypto market enjoyed some incredible demand in 2021. Hedera came out just in time to get in on some of this action, and it has been benefiting immensely from the market sentiment, which has remained mostly bullish. During the first half of this year we saw Hedera Hashgraph surge higher, as the sentiment turned extremely bullish. HBAR/USD surged from below $0.030 to almost $0.45, which means a gain in value of around 1,500% in a few months.
Then came the pullback during spring, as the crackdown on cryptos by the Chinese government began to hurt the sentiment in the market. That lasted until July, when the sentiment improved again for cryptocurrencies, and Hedera turned bullish. It increased from around $0.14 to $0.57, meaning that it has gained around 400% in value, as the sentiment remains bullish in the market. In fact, in the last few months, Hedera Hashgraph has been performing better than the market average, gaining even during September, when most of the crypto market closed that month at a loss.
Hedera Owned and Governed by Leading Global Companies
We mentioned above that Hedera is owned and governed by 39 major global companies in many different sectors, which have a limited term. Some of these companies are Boeing, Chainlink Labs, IBM, Google, LG, Deutsche Telecom, Nomura etc. All governing council members have one vote, irrespective of their size. This guarantees democracy and an equal voice in terms of the company’s development. The goal of the council is to govern software changes and bring in stability and decentralization. Some of the market decisions include:
- Direction of platform and public network node codebase features and functions
- Treasury management to ensure overall network safety
- Controlled mutability to address legal and data compliance
- Legal network requirements to serve global markets
The hedera network and its cryptocurrency have a no-fork guarantee, meaning that divergences might not be allowed, as in the case of Bitcoin, Bitcoin Cash and Bitcoin SV. It might look a little conservative in further development. The Hashgraph consensus algorithm is proprietary, with an open review code, which can be updated continuously. This ensures long-term confidence and stability in terms of development for application builders.
Ethereum (ETH) Price Prediction For 2022: The $5,000 Level is the Next Target
Bitcoin (BTC) Price Prediction For 2022: BTC/USD Targeting $100,000
Technical Analysis – HBAR/USD Forming the Second Bullish Leg
HBAR/USD Monthly Time-frame – Moving Averages Can’t Catch Up
On the technical front, Hedera Hashgraph is looking strong once again, after the retreat in spring. On the monthly chart above, we see that HBAR/USD was trading sideways last year, while it started surging in January this year. It made some massive gains, but in April, the price started reversing lower, and it ended up losing around 65% of its value. However, after the small hammer candlestick at the bottom – which is a bullish reversing signal – this crypto turned bullish again. The price has increased several times, and HBAR is looking quite bullish once again, even after the pullback in the crypto market in September. Moving averages haven’t been able to catch up, which shows that buyers are in complete control right now, and after the failed crackdown on cryptos, there’s not much to hold HBAR down.
HBAR/USD Weekly Time-frame – The 50 SMA Held Well in Summer
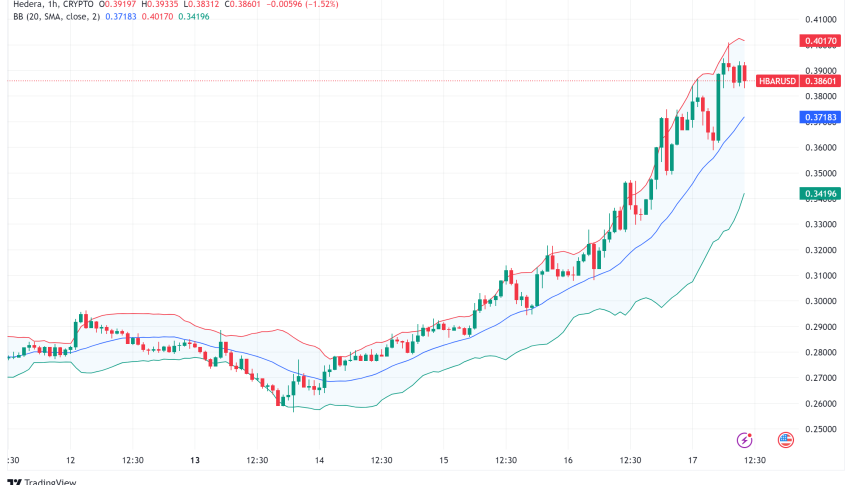
The weekly chart also supports the idea that buyers are in total control. After coming down for three months, following the strong bullish run of the first three months, the price is looking very bullish once again, despite the consolidation of the last few weeks. During the downward retreat, the 20 SMA (gray) provided some form of support, but it was broken without much resistance. Then the 50 SMA came to the rescue, holding on a few attempts, and starting to push the lows higher. The price bounced off of it, towards the end of July, and the surge resumed again in August and September. In the second half of September 2020, we saw a pullback, as the sentiment in the crypto market turned negative, due to the escalation on the crypto crackdown, but the 20 SMA (gray) turned into support on the weekly chart. Now HBAR/USD is consolidating the gains above the 20 SMA and it should soon resume the third leg of the uptrend. If the price continues to retrace lower, the 50 SMA would be a good place to go long from.
HBAR/USD Daily Time-frame – Returning to the 20-monthly SMA again?
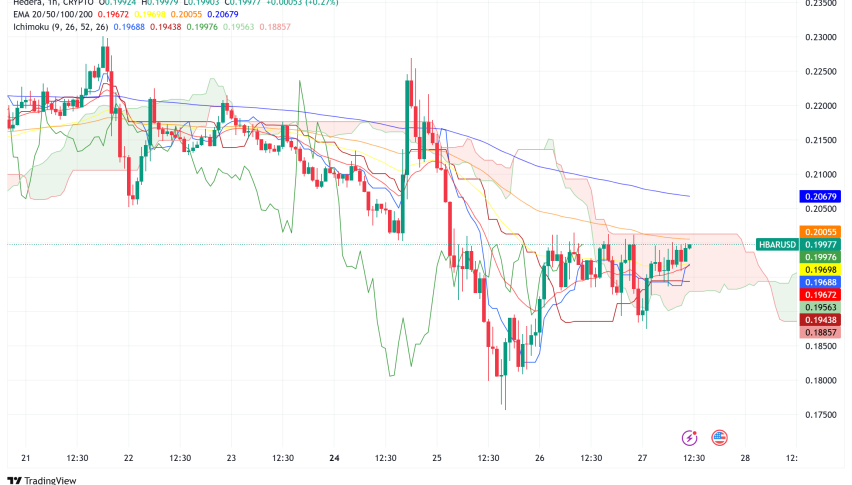
On the daily chart, the bullish trend has also been quite visible since late July. We see that moving averages were providing support during the pullback lower, particularly the 100 SMA (green). Then they turned into resistance, once having been broken, particularly the 50 SMA (yellow), as it pushed the price down below the 200 SMA (purple). Now they have turned into support again, which means that the trend is bullish. During the first half of September, we saw a very strong surge higher, but the price came back down in the last two weeks of that month – however, the 50 SMA (yellow) held as support on the daily chart. That moving average has been pushing the lows higher, so buyers are in control here as well, and we expect a bounce off the 50 SMA soon.