Prices Forecast: Technical Analysis
For the daily forecast, VeChain is expected to close at approximately $0.0225, with a range between $0.0215 and $0.0235. The weekly forecast suggests a closing price of around $0.0230, with a range from $0.0210 to $0.0240. The RSI is currently at 49.4695, indicating a neutral trend, while the ATR at 0.0012 suggests moderate volatility. The ADX at 22.6685 shows a weak trend, implying that significant price movements are unlikely in the short term. The MACD line is slightly below the signal line, suggesting a potential bearish crossover, but the histogram indicates minimal momentum. These technical indicators, combined with the economic calendar showing stable macroeconomic conditions, suggest a cautious outlook for VeChain in the near term.
Fundamental Overview and Analysis
VeChain has experienced a relatively stable price trend recently, with minor fluctuations. The asset’s value is influenced by its utility in supply chain management and partnerships with major corporations. Investor sentiment appears cautiously optimistic, as the asset’s technological advancements and real-world applications provide a solid foundation for growth. However, challenges such as market volatility and regulatory scrutiny pose risks. VeChain’s current valuation seems fair, given its potential for scalability and expansion. The asset’s ability to integrate with existing systems and provide transparency in supply chains is a significant advantage. Nonetheless, competition from other blockchain platforms and potential regulatory changes could impact its growth trajectory.
Outlook for VeChain
VeChain’s future outlook is moderately positive, with potential developments in its technology and partnerships likely to drive growth. Historical price movements show a pattern of gradual increases, with occasional dips due to market volatility. The primary factors influencing VeChain’s price include economic conditions, technological advancements, and regulatory changes. In the short term (1 to 6 months), VeChain’s price is expected to remain stable, with minor fluctuations. Long-term forecasts (1 to 5 years) suggest potential growth, driven by increased adoption and technological improvements. External factors such as geopolitical issues or market crashes could significantly impact the asset’s price. Overall, VeChain’s outlook is cautiously optimistic, with opportunities for growth balanced by potential risks.
Technical Analysis
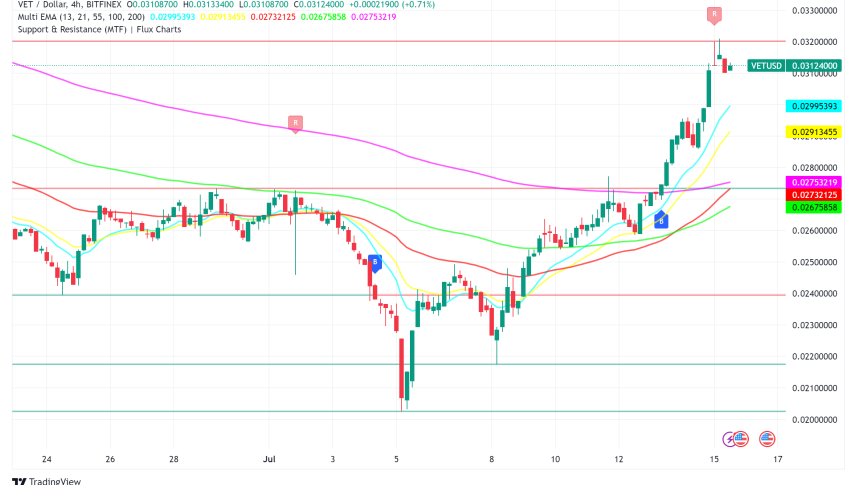
Current Price Overview: The current price of VeChain is $0.0221, slightly below the previous close of $0.0221. Over the last 24 hours, the price has shown minimal movement, indicating low volatility. Support and Resistance Levels: Key support levels are at $0.0210, $0.0205, and $0.0200, while resistance levels are at $0.0230, $0.0235, and $0.0240. The pivot point is at $0.0220, with VeChain trading slightly below it, suggesting a neutral to bearish sentiment. Technical Indicators Analysis: The RSI at 49.4695 suggests a neutral trend, while the ATR at 0.0012 indicates moderate volatility. The ADX at 22.6685 shows a weak trend, and the 50-day SMA is slightly above the 200-day EMA, indicating a potential bullish crossover. Market Sentiment & Outlook: Sentiment is currently neutral, with price action near the pivot, a neutral RSI, and weak ADX. The moving average crossover suggests potential bullish momentum, but the low ATR indicates limited volatility.
Forecasting Returns: $1,000 Across Market Conditions
The table below outlines potential returns on a $1,000 investment in VeChain under different market scenarios. In a Bullish Breakout scenario, a 10% price increase could result in an estimated value of $1,100. In a Sideways Range scenario, with a 0% change, the investment remains at $1,000. In a Bearish Dip scenario, a 10% decrease could reduce the investment to $900. These scenarios highlight the importance of market conditions on investment outcomes. Investors should consider their risk tolerance and market outlook when deciding to invest in VeChain. Diversification and regular portfolio reviews can help manage risks and optimize returns.
| Scenario | Price Change | Value After 1 Month |
|---|---|---|
| Bullish Breakout | +10% to ~$0.0243 | ~$1,100 |
| Sideways Range | 0% to ~$0.0221 | ~$1,000 |
| Bearish Dip | -10% to ~$0.0199 | ~$900 |
FAQs
What are the predicted price forecasts for the asset?
The daily forecast for VeChain suggests a closing price of approximately $0.0225, with a range between $0.0215 and $0.0235. The weekly forecast indicates a closing price of around $0.0230, with a range from $0.0210 to $0.0240.
What are the key support and resistance levels for the asset?
Key support levels for VeChain are at $0.0210, $0.0205, and $0.0200, while resistance levels are at $0.0230, $0.0235, and $0.0240. The pivot point is at $0.0220, with the asset currently trading slightly below it.
What are the main factors influencing the asset’s price?
VeChain’s price is influenced by its utility in supply chain management, partnerships with major corporations, and technological advancements. Market sentiment, economic conditions, and regulatory changes also play significant roles in determining its value.
What is the outlook for the asset in the next 1 to 6 months?
In the short term, VeChain’s price is expected to remain stable, with minor fluctuations. The asset’s outlook is cautiously optimistic, with potential growth driven by increased adoption and technological improvements, balanced by risks such as market volatility and regulatory scrutiny.
Disclaimer
In conclusion, while the analysis provides a structured outlook on the asset’s potential price movements, it is essential to remember that financial markets are inherently unpredictable. Conducting thorough research and staying informed about market trends and economic indicators is crucial for making informed investment decisions.