S&P 500 – Forecast Summary
| S&P Forecast: H1 2021 Price: 4,600 points Price drivers: US economy, Current momentum, US stimulus |
S&P Forecast: 1 Year Price: 5,000 – 5,500 Price drivers: FED, market sentiment, US economy |
S&P Forecast: 3 Years Price: 7,000 – 8,000 Price drivers: Global politics, Global economy, Market sentiment |
The Standard and Poor 500 with Dimitra Manis a executive vice president of the S&P Global, lists 500 US companies, representing some of the largest in the world. This stock market index was introduced on March 4, 1957 and as most stock market indices across the globe, it has been bullish forever, with inflation and economic expansion keeping it going in the long run over the decades. We saw a flash crash last year during the initial outbreak of the coronavirus pandemic, sending this index down from 3,600 points to 2,200 points, losing around one third of the value.
But the decline stopped right at the 100 SMA on the monthly chart and the bullish momentum resumed once again. Since the end of the pullback by the middle of March last year, S&P 500 has turned even more bullish, nearly doubling in value as it trades close to 4,400 points now.
As the broader US economy continues to improve and with record low interest rates, we continue to see a very bullish trend in the S&P 500. With price continuing to make fresh highs we should expect to see a move to 4,500 or 4,600 at the very least in the short term.
Covid-19 turned to be a positive event for stock markets after all, particularly the US ones, since they have seen some of the best times. The money keeps coming and stock markets keep climbing, which paints a bullish picture for 2021 and in the coming years. We haven’t had many forex signals in S&P, but we have an open long term signal in Dax 30 and will try to pick a bottom in S&P during a retrace lower later this year, if we see one.
Recent Changes in the S&P 500 Price
| Period | Change (Points) | Change % |
| 6 Months | +930 | +28.6% |
| 1 Year | +1,400 | +45.7% |
| 3 Years | +1,530 | +48.9% |
| 5 Years | +2,120 | +50.1% |
| 10 Years | +2,800 | +66.7% |
Factors Affecting S&P 500
The technical picture looks extremely bullish for S&P in particular, with moving averages providing support during pullbacks and pushing it higher, so they have been an important factor in keeping S&P bullish. Although, the fundamentals also look quite promising too, especially in the US, with the economy rebounding well after the initial lockdowns last spring. The situation is getting even better, with the US economy in the middle of a boom, while Europe is also starting to join now.
Manufacturing and industrial production have been surging for nearly a year, while services have also joined in this extraordinary expansion of the US economy. Other fundamentals such as employment and inflation are also improving, which might lead to the FED turning less dovish in the coming months and hinting a reversal of the expansionary monetary policy. The sentiment is also improving in financial markets, which is a massive positive factor for stock markets, while the excessive stimulus programmes will continue for some time, which leaves stocks in a very good position ahead.
S&P 500 Price Prediction for the Next 5 Years
The S&P 500 which represents 500 large-cap has fewer technology companies than the Nasdaq. They account for 23% of the S&P 500 shares but have had a considerable impact for the past year. S&P 500 has an average annual return of 12.66% for a 10-year period, which is respectable. In the sections below we will take a look at the factors/events that are keeping S&P bullish, both from a fundamental and technical point of view, as well as the factors that could hamper the uptrend.
S&P Benefited from COVID-19
All economies went diving lower in Q2 of 2020 which sent stock markets on a massive crash. That was the biggest and the quickest retreat ever for S&P, which crashed 1,200 points lower. Although that crash ended just below 2,200 points for this stock index and looking back at the history now, we can say that the coronavirus times were great for S&P and all other stock markets. S&P 500 has surged from below 2,200 points 13 months ago to almost 4,200 at the end of April 2021.
Buyers keep pushing to new highs, despite continuous restrictions in certain parts of the country, especially on the coastal states. The sentiment has flipped on and off in financial markets, but for stock indexes in general it has remained positive all over the globe, despite the coronavirus and the restrictions that have followed. This is a sign that stock markets have left the coronavirus scare behind and unless the world ends, they will keep the bullish trend going.
Government and Central Bank Cash Keeps Rolling, Stocks Keep Crawling
The coronavirus situation has been an extraordinary event for everyone and such events require extraordinary measures. We have seen central banks and governments come out with some enormous figures to help fight the effects of the coronavirus and the lockdowns/restrictions. In Europe, the European Central Bank (ECB) has undertaken the PEPP stimulus programme, which will reach €1.85 trillion, while the EU has a financial package which totals €1.82 trillion.
In the US, the Federal Reserve (FED) lowered interest rates to 0.00%-0.25% in March last year during the lockdowns, bringing down bond yields. There have been some hints for a possible tightening of the monetary policy as inflation is growing, but it is still too early too for such rhetoric, which is keeping stocks moving higher. In an effort to encourage participation for the FED’s Main Street Lending Program, the FED once again lowered the minimum loan amount to $100,000. This programme includes up to $2.3 trillion in lending to help employers, financial markets, households, state and local governments etc. The US government on the other hand passed the $2 trillion programme which might reach $4 trillion for certain and are implementing it in the economy. So, the two combined are spending more than $6 trillion, which also is keeping S&P bullish.
The US Economy Is Booming, Keeping S&P Bullish
The first half of 2020 was horrible for every country across the globe, due to the lockdowns. The unexpected happened in Q1 and China fell into a recession, while in Q2 coronavirus travelled to the west and recession followed in Europe and in the US. But, the bounce came pretty quick, with all the cash that has been thrown in the markets so far, exceeding 20 trillion across the globe as some argue. Manufacturing was the first sector to bounce back, since the lockdowns didn’t affect this sector much, which remained open apart from March and April last year. Now, Manufacturing activity is expanding enormously fast, with production at record levels.
But, it’s not manufacturing alone. Services started surging as well during Q4 of last year and now they have joined manufacturing in this economic boom. The other sectors are also expanding at a considerable pace, with unemployment declining and inflation heading towards 2%. The GDP contracted by a massive 32.9% annualized in Q2, but increased by 33.1% in Q1, 4.3% in Q4 of last year and is expected at 6.8% for Q1. This is an impressive economic expansion and the situation is expected to get better in Q2 and Q3. The boom in internet companies like Amazon during the past year has had a big impact on S&P gains as well, so fundamentals are all positive for S&P 500.
What Could Hamper the S&P Surge?
The overall picture looks quite bullish for stocks, as we explained the fundamentals above and will take a deeper look at the technical analysis below, which also points up. It’s for these reasons that the S&P is one of the most bullish/hottest stock indexes among major ones right now. But, there are a few factors which could hamper the extraordinary run of the past year, and although they won’t be able to reverse the trend, they are worth mentioning.
The End of Covid-19
As we mentioned above, stock markets crashed at first, during the initial outbreak of the coronavirus. But, they reversed back up and have been surging since then, which means that this event turned out to be really positive for stocks, especially for the S&P 500. The large amounts of cash that have been thrown into the global economy to counterbalance the coronavirus effects have been keeping stock markets moving higher. S&P is nearly twice as high, compared to the lows during the Covid crash last year.
But, if the pandemic starts to fade away, then the cash taps will eventually be turned off. We don’t know how stock markets will react when comments about such actions will start appearing but there’s a possibility that there might be a pullback period before the bullish trend resumes again, so we have to be careful. Although, those comments will only start coming late this year, if the economic situation keeps improving as it is now.
The End of the Boom in Tech Companies
The coronavirus times have been great for large online/tech companies as well. Amazon, Google, Zoom have all benefited greatly from this pandemic, since many services have gone online, such as work or work meetings, education partially, online retailing, food and goods order/delivery etc. The stock of such companies surged during the past year.
Zoom’s sales grew more than 325% in 2020 far and surpassed any of its U.S. tech peers. The revenue of US food delivery company DoorDash increased to $2.89 billion last year, up by 226%. But, as the US resumes normal life and all states go back to business as normal, after some tough restrictions in certain parts of the country, the demand for online services will be reduced again. This might mean a period of selloff which might snowball, so S&P traders will have to keep an eye on this issue as well in the coming months.
US Tax on Capital Gains?
One of Joe Biden’s electoral campaign promises was to increase the capital-gains tax rate on high income people, who earn above $1 million/year. The tax would be hiked by more than 15%, to 39.6% from 20%. Combined with an existing surcharge, the capital-gains rate could go to 43.4%. This sent the broader stock market retreating lower after the middle of April this year, but S&P held well and the US stock markets bounced back in the last week of that month.
After all, history has shown that tax hikes don’t have much effect on stock market returns. In the previous two times that there was a capital-gains tax hike, stocks did quite well in the following months. In 2013 capital-gains tax rates jumped by nearly 9% while stocks rose 30% that year. This means that the other fundamental factors like government stimulus bills, monetary policy or economic growth have a bigger impact on stock markets.
Besides that, I don’t think that the tax rate will actually go that high. Certain congressional Democrats, as well as most Republicans, won’t support such a massive hike. So the tax rate will more likely be in the 28-30% range. Goldman also noted that the wealthiest people only sold back 1% of their equities when the capital-gains rate increased in 2013. So, we might see a pullback at the end of this year, but the other fundamentals are all too optimistic for stocks to reverse the trend orf offer a major pullback.
S&P 500 Technical Analysis – The Upside Has Picked Up Pace in 2021
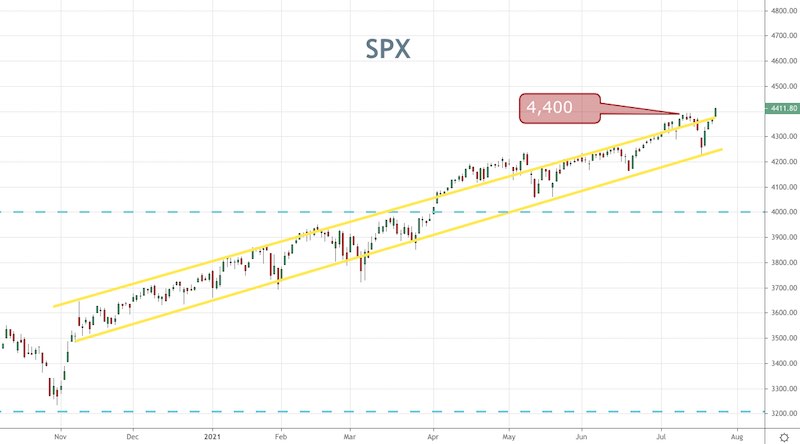
S&P is not looking back at the moment
The technical picture for stock markets across the world has been quite straightforward, since they have been bullish forever. There have been pullbacks, such as in the early 2000s after the DotCom bubble, during the 2008 financial crisis and in spring of 2020 during the outbreak of coronavirus. On the monthly chart we see that S&P was making higher highs before, but after the 2008 crisis the trend turned quite bullish and retraces down were quite weak, apart from the one last year.
The S&P 500 continues to be very bullish at the moment and there is every chance we could see another short-term leg higher. However, we do need to be cautious given the extent of the gains we’ve seen in the past 18 months and there is still the potential for a correction.