Gold Completes 50% Retracement – What’s Next?
What's up, fellas. Hope you enjoyed our previous update on Oct. 16 - A Potential Trade Setup In Gold. The precious metal plunged after test
•
Last updated: Wednesday, October 18, 2017
What's up, fellas. Hope you enjoyed our previous update on Oct. 16 – A Potential Trade Setup In Gold. The precious metal plunged after testing our target level. Here is what I'm looking at today.
Quick Technical View
- Gold plunged dramatically but finally gained some support near $1,281. Let me break down the technical aspects of the Gold.
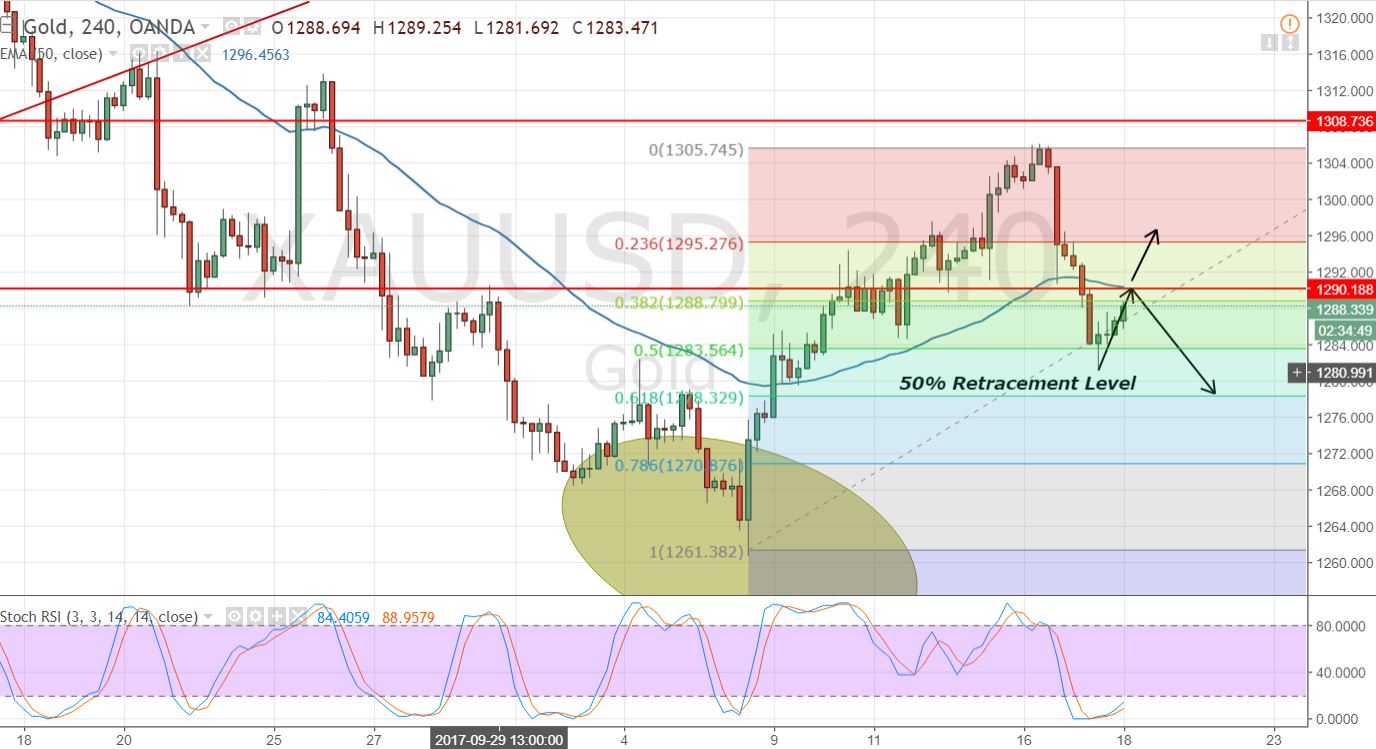
- Gold has completed the 50% Fibonacci retracement at $1,281. That's the level where market pulls back.
- Looking at the momentum indicators, the Gold is oversold in the 4-hour chart. The RSI and Stochastics are holding below 20. It's also supporting the bullish retracement now.
 Gold – 4 – Hour Chart – Fibonacci Retracement
 Gold – 4 – Hour Chart – Fibonacci Retracement
- The leading indicator 50 – Periods EMA is ready to provide resistance at $1,291. We can expect a bearish pullback.
- For the moment, the Gold is in a very narrow range with a lower range of $1,287 and upper range of $1,292. The breakout will decide the further trend.
Gold // XAUUSD – Trading Plan
Today, the idea is to stay bearish below $1,292 with a stop loss above $1,295. On the other hand, break below $1,287 can give us an opportunity to sell for $1,284 with 20 pips stop. Good luck fellas, keep following for more updates.
- Check out our free forex signals
- Follow the top economic events on FX Leaders economic calendar
- Trade better, discover more Forex Trading Strategies
- Open a FREE Trading Account
ABOUT THE AUTHOR
See More
Arslan Butt
Lead Markets Analyst – Multi-Asset (FX, Commodities, Crypto)
Arslan Butt serves as the Lead Commodities and Indices Analyst, bringing a wealth of expertise to the field. With an MBA in Behavioral Finance and active progress towards a Ph.D., Arslan possesses a deep understanding of market dynamics.
His professional journey includes a significant role as a senior analyst at a leading brokerage firm, complementing his extensive experience as a market analyst and day trader. Adept in educating others, Arslan has a commendable track record as an instructor and public speaker.
His incisive analyses, particularly within the realms of cryptocurrency and forex markets, are showcased across esteemed financial publications such as ForexCrunch, InsideBitcoins, and EconomyWatch, solidifying his reputation in the financial community.