The Japanese Yen is Gathering Steam Again; The CAD is Standing Its Ground
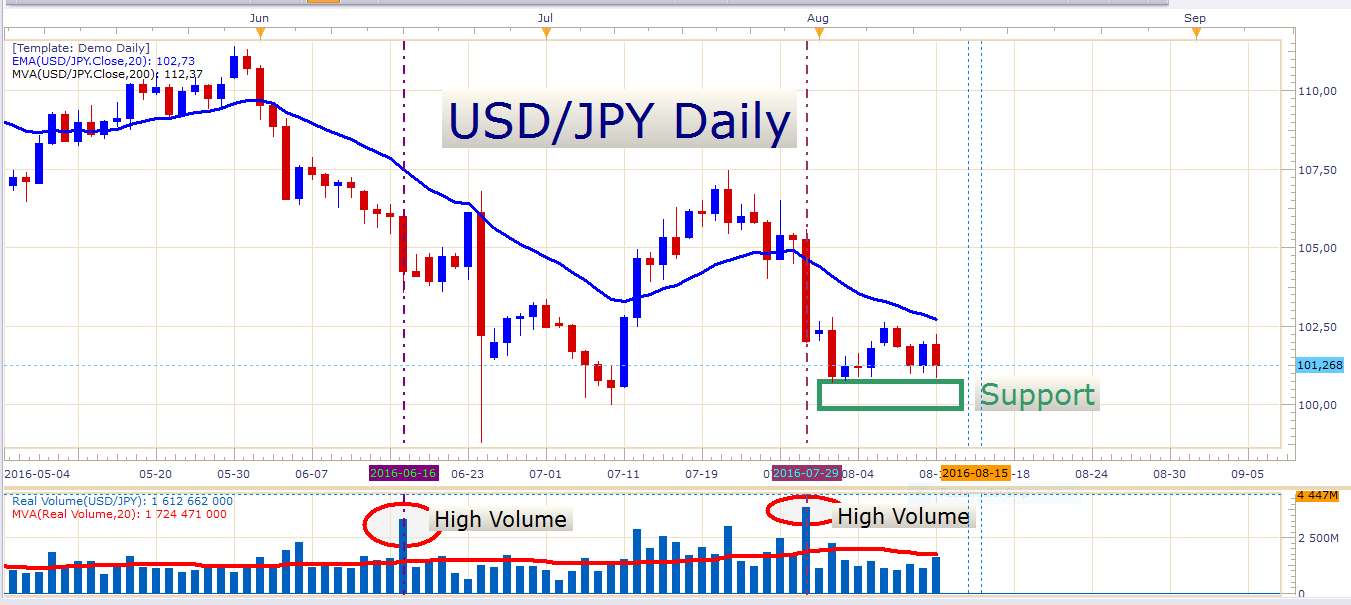
Following the disappointing economic figures out of the United States on Friday, the US dollar initially sold off aggressively. On some pairs the decline didn’t last very long, however. The pound gained about 65 pips against the Buck in the first 10 minutes after the release, but then the Buck bounced back and drove the pound down about 120 pips from there to close at 1.29164 for the day. Similarly, the Australian dollar gained a quick couple of pips against the US dollar only to give it (and many more pips) back to the USD soon afterward. On the other hand, the Swiss Franc, Euro, and Canadian dollar managed to hold at least some of their gains against the Greenback. The best performer by far was the Japanese Yen which gained an impressive 118 pips against the US dollar and had given back only 43 pips by the end of the trading day.The Japanese Yen has been strong for many months already, and the USD/JPY looks like it’s ramming against support again. The pair has not been able to manage a daily close below the big 100 level recently, which could be expected to be a difficult level to overcome. Nevertheless, if we see this level fold, the Yen might continue to gain further ground against the dollar, and also against many other currencies. Personally, I have bought the Yen against different currencies and I will be on the lookout for more opportunities to utilize its strength in the near future. Let’s look at some charts.
USD/JPY
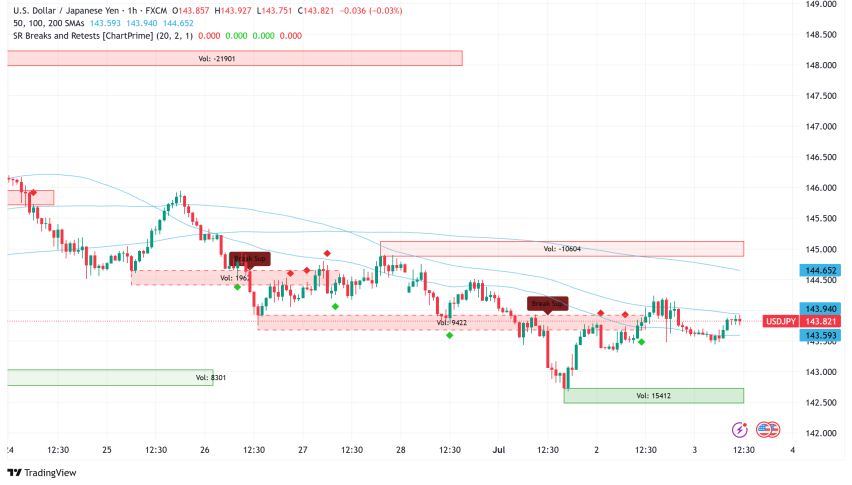
USD/JPY Daily Chart
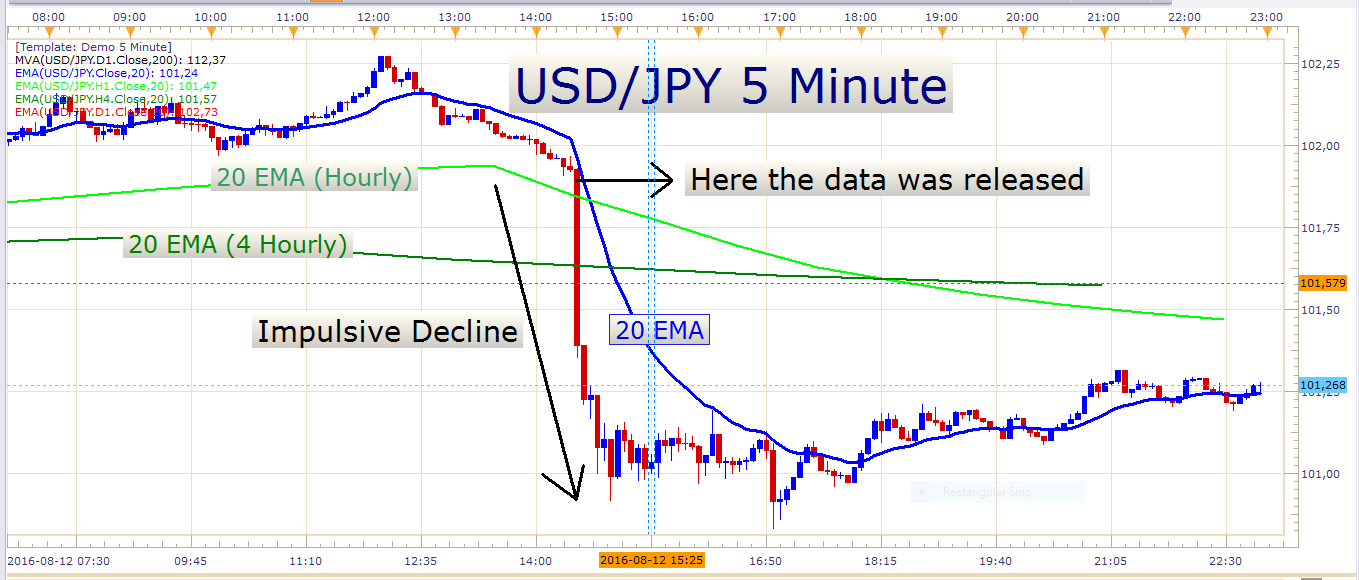
Here we see that in the last few days the pair has been unable to attract enough buyers to fuel a decent bounce. The 20-period exponential average remains a resistor to price – as you can see the exchange rate wasn’t even able to touch it last week. The pair’s reaction to the weak US data on Friday encourages my bearish bias. Look at the massive decline on Friday following the news release:
USD/JPY 5 Minute Chart
I still like the idea of selling weak bounces on the USD/JPY. Retail positioning on this pair remains very extreme. At the moment there are 4.17 traders that are long for every trader that is short. This suggests that we might see further losses in the exchange rate. Any reading above 2 or below -2 is considered to be extreme. Traders can observe price action tomorrow and see if we get weak pullbacks to perhaps the 20 exponential moving average on either the hourly or 4-hour charts. As I always say, I like to observe how price reacts to the specific resistance levels I’m watching, in order to gauge the quality of a possible entry. Sometimes I place pending orders on certain moving averages or levels I’m watching, at other times I place market orders after observing price action like mentioned above. Both methods have their pros and cons.
We do have some economic data releases out of Japan early tomorrow morning including 2nd quarter GDP numbers. We’ll see if we get some market movement out of that.
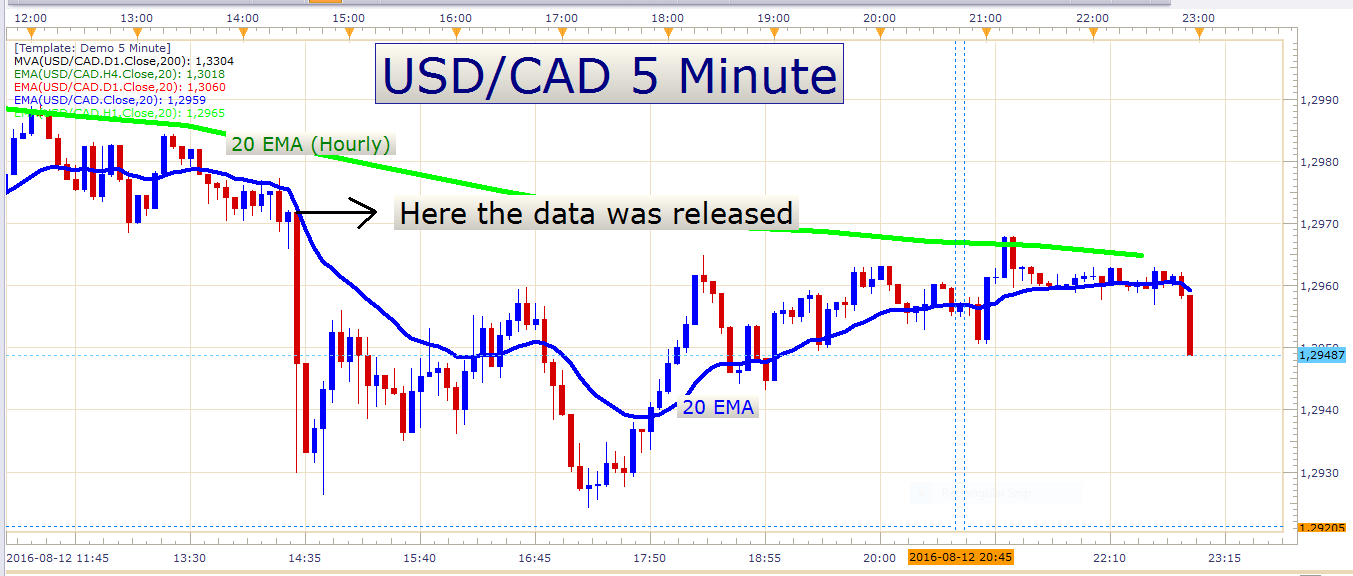
Besides the Yen being so strong, the CAD is also still performing very well. Let’s look at Friday’s news reaction on the USD/CAD.
USD/CAD
USD/CAD 5 Minute Chart
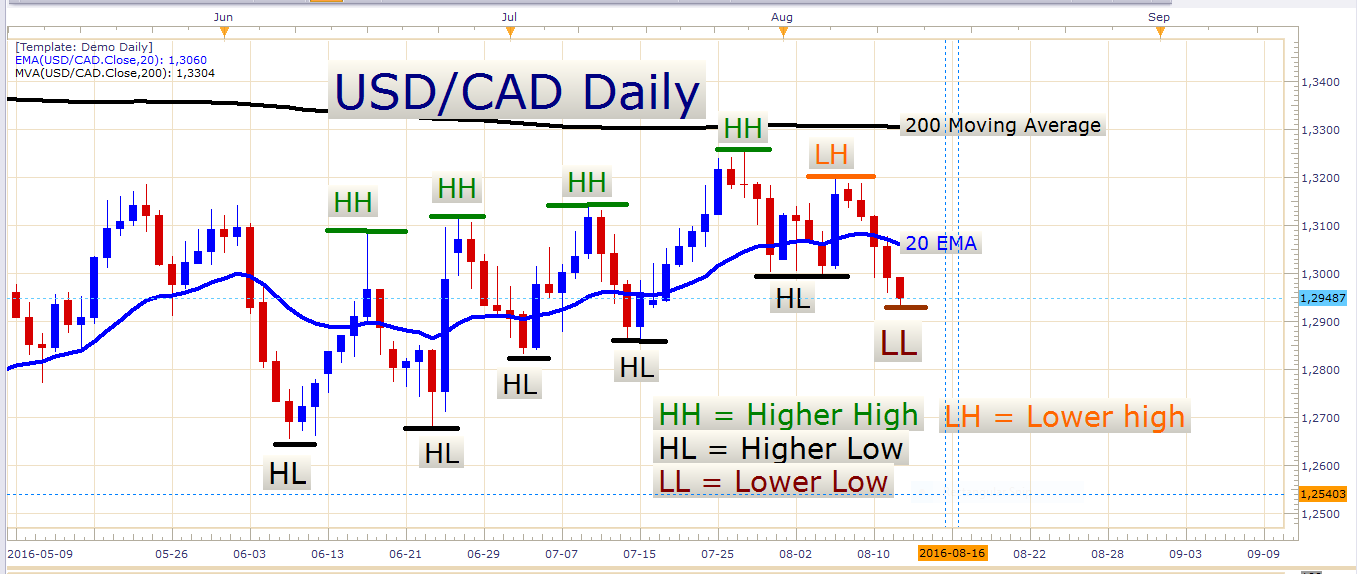
The decline resulting from Friday’s news was not as intense as with the USD/JPY. In this chart, you can see that price almost retraced to the level where the data was released. Nevertheless, if we look at larger time frames it is evident that the Canadian Dollar is not ready to back off. Look at the daily chart:
USD/CAD Daily Chart
As mentioned in Friday’s trading plan, the recent bullish formation of higher highs and higher lows has recently been broken. Here we can see that a lower swing high was formed at the orange line, and a lower swing low at the brown line. This indicates that the buyers are not in control at the moment. On this chart, you can see that there wasn’t even one blue candle in the last week. Sellers were dominating the scene all the time with an impressive 5 red daily bars in a row.
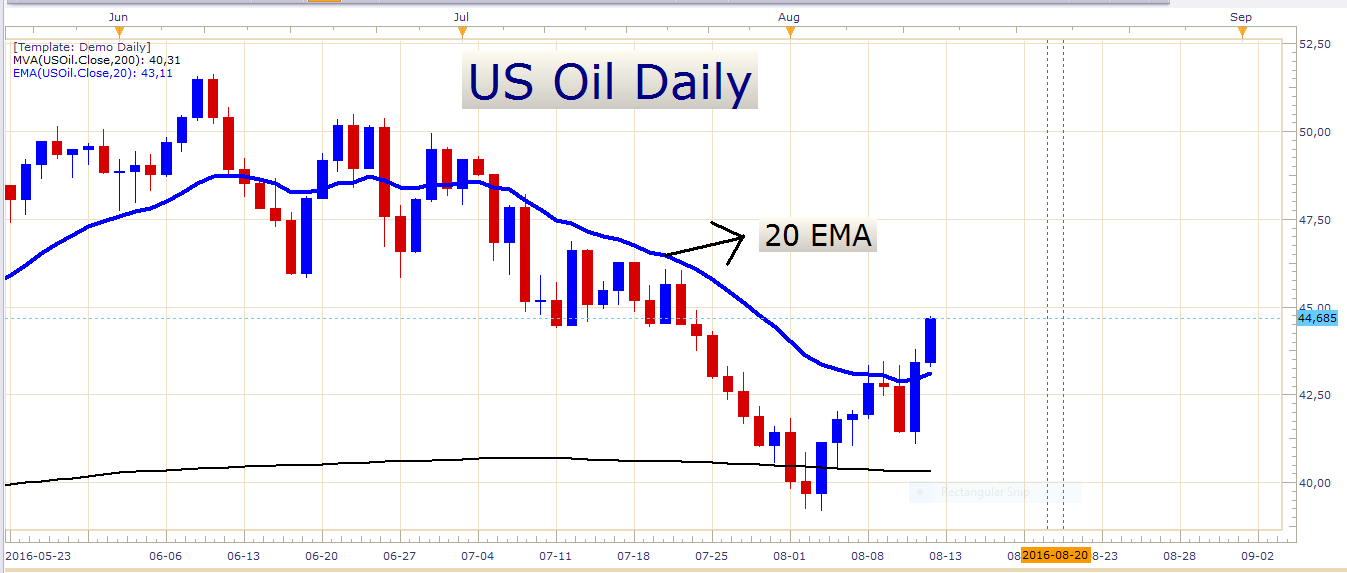
Besides the technicals pointing to a further decline in the USD/CAD, oil prices have been boosting the Canadian dollar tremendously. On Friday US Oil posted a firm daily close above the 20 exponential moving average. Look at the chart below:
US Oil
US Oil Daily Chart
As we know, oil prices and the Canadian dollar are highly correlated. Here we see that the oil price has recently been resisted by the 20 EMA, rejecting off of it a few times before finally breaking through it mightily. If we see a further rise in the oil price it would be positive for the Canadian dollar. Let’s look at an hourly chart of the USD/CAD:
USD/CAD
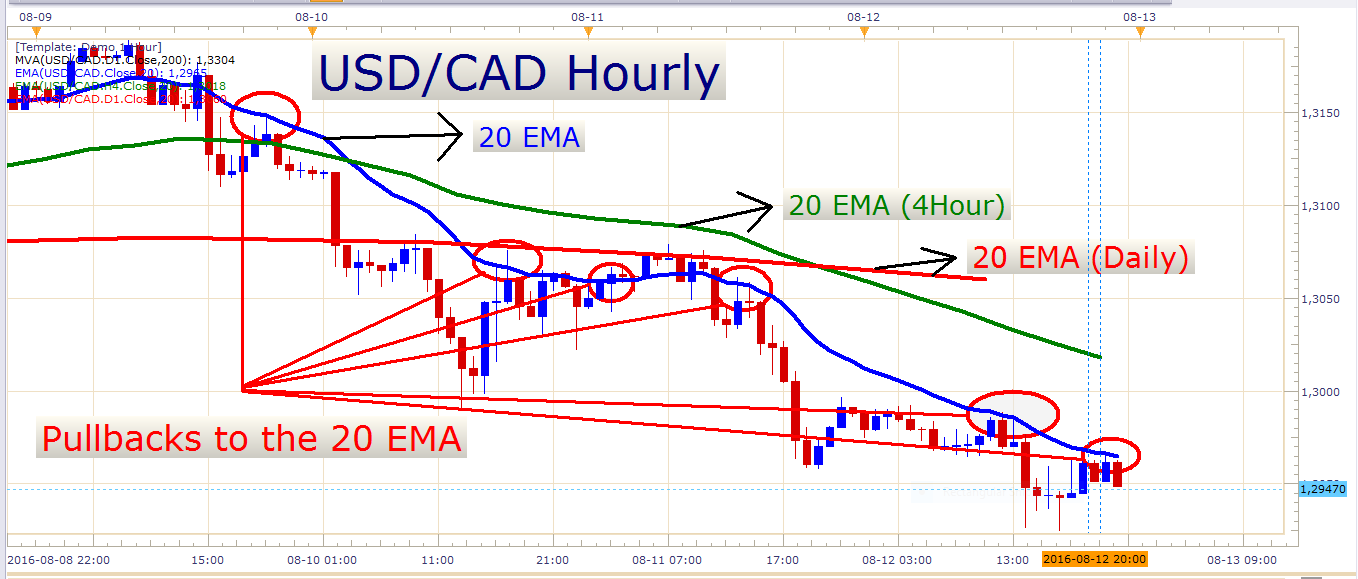
USD/CAD Hourly Chart
With a strong decline like this, there is often a lot of action around the 20 EMA on an hourly chart as seen above. Notice how many times price retraced to this exponential moving average (the blue moving average), and consider the favourable risk to reward ratio that could have been obtained with short entries placed on it. Of course you will encounter losses using this approach, but you will definitely make some profits as well. Forex trading is all about trading probabilities, and we need to use strategies which give us an edge in the market. In the right circumstances selling pullbacks to the 20 EMA on an hourly chart can provide such an edge. On the USD/CAD, a trader could sell at the 20 EMA with a stop loss of 50 pips and a target of 100 pips giving him a 1:2 risk to reward ratio. This is just an example, and traders should consider the instrument’s volatility, support and resistance levels, and other factors when deciding on stop loss and take profit placement.
Furthermore, we don’t have a lot of important economic data scheduled for tomorrow besides the Japanese GDP numbers mentioned earlier, and a speech by RBNZ governor Mr. Wheeler late tomorrow evening. There are also holidays in India, South Korea, and Italy.
That’s all for today, profitable trading!
- Check out our free forex signals
- Follow the top economic events on FX Leaders economic calendar
- Trade better, discover more Forex Trading Strategies
- Open a FREE Trading Account
