The US Dollar is UP Against The Ropes… But Still Hanging in There
The very important FOMC meeting caused quite a bit of choppiness in the FX market yesterday. The initial effect was US dollar strength but this lasted only for about a minute. Then the US dollar sold off aggressively for about 15 minutes. After this dip, the Buck managed to recover some of its losses again. So, after all, we had quite a mixed market reaction to the event, with the dollar losing about 20 to 35 pips against most major currencies. Of the majors the big loser on the day was the Australian dollar which lost about 48 pips against the US dollar. We have some important economic data scheduled for today of which the first event concerns the AUD. The employment numbers out of the region are released at 01:30 GMT. Let’s look at the Aussie.
AUD/USD
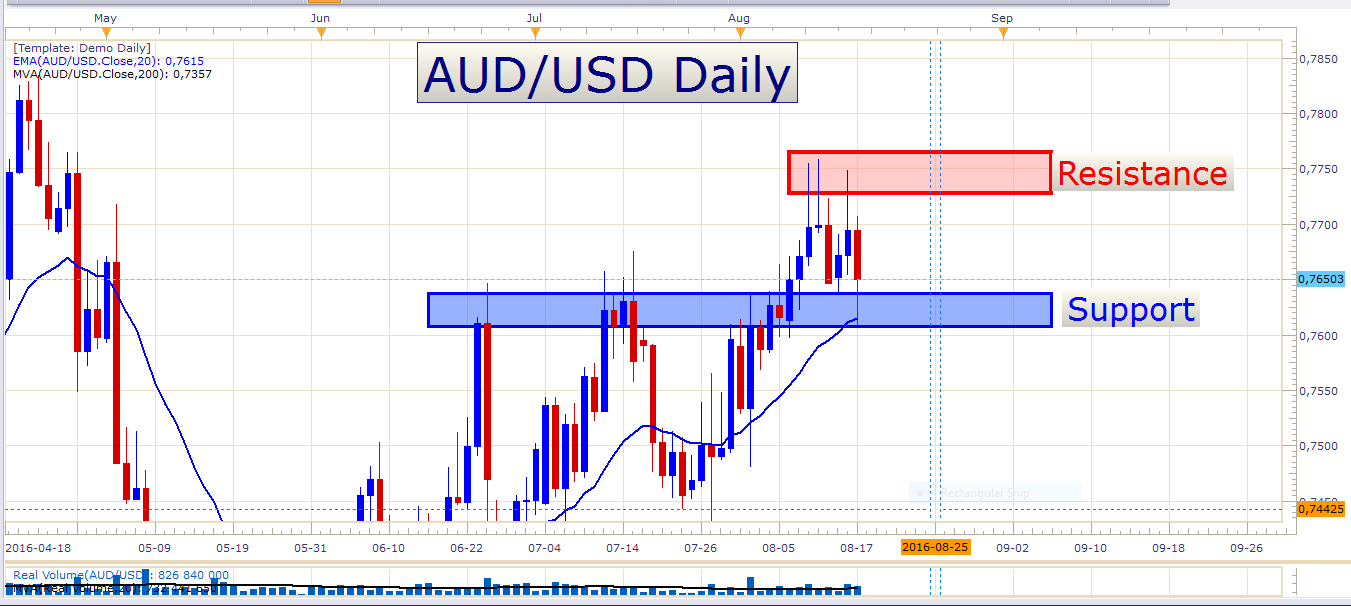
AUD/USD Daily Chart
Notice how the three long wicks touching the resistance zone in this chart acted as a pretty good prediction of the decline that we saw on this pair yesterday. The middle candle is a beautiful shooting star candle preceded by an extended bullish move. This was an excellent signal to short the pair. What makes this pair tricky to trade, however, is the fact that although we saw a decent decline, the pair remains supported by the 20 exponential moving average on the daily chart. Notice how yesterday’s candle just kissed off the 20 EMA, leaving a wick of about 43 pips by the end of the day. Whether the correction is over or not we don’t know, but one thing is certain – these last couple of days a thick layer of resistance has formed in the region of 0.7750. The retail sentiment is slightly negative which suggests a mild bullish bias, but when this sentiment is so neutral it is less reliable to formulate a solid directional bias from it. If we look at a bigger picture of the pair, it is evident that the Australian dollar is having a hard time to overcome the US dollar. Look at this weekly chart:
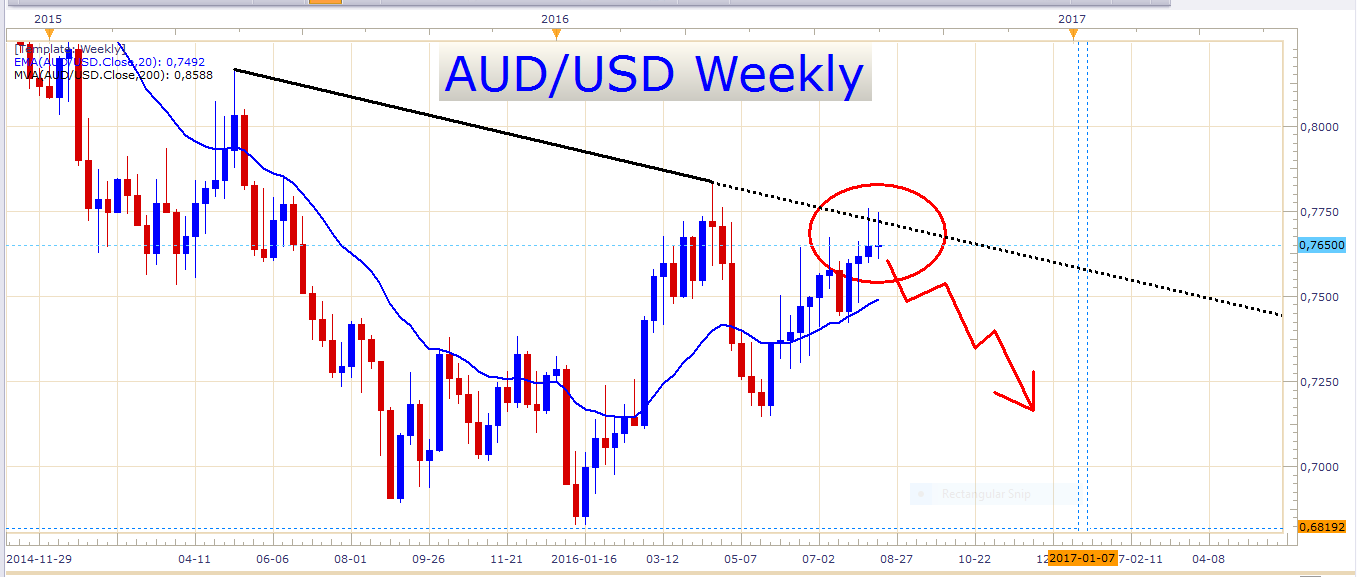
AUD/USD Weekly Chart
Amazing, isn’t it? Look at how price reacted to this descending trend line. At the moment there are two strong rejections off of this trend line. Of course the second candle has not closed yet, but up until now, the price has not been able to stay above this trend line. I really like the wicks to the upside, and if the price were to close the week at this level I would be even more interested in shorting this pair. Remember that trading off of weekly charts requires much more patience than for example day trading or scalping.
What also interests me about this pair is the fact that the price action of the last three or four days was not able to reach the previous swing high that was set on the 16th of April earlier this year. At the moment what we see is a lower low in the process of being formed. If this descending trend line continues to cap the exchange rate, we could expect the 0.7250 level to come into focus soon. Remember that the Australian employment numbers are released in a few hours and that this data could have quite a market moving effect on the pair. Let’s look at an hourly chart:
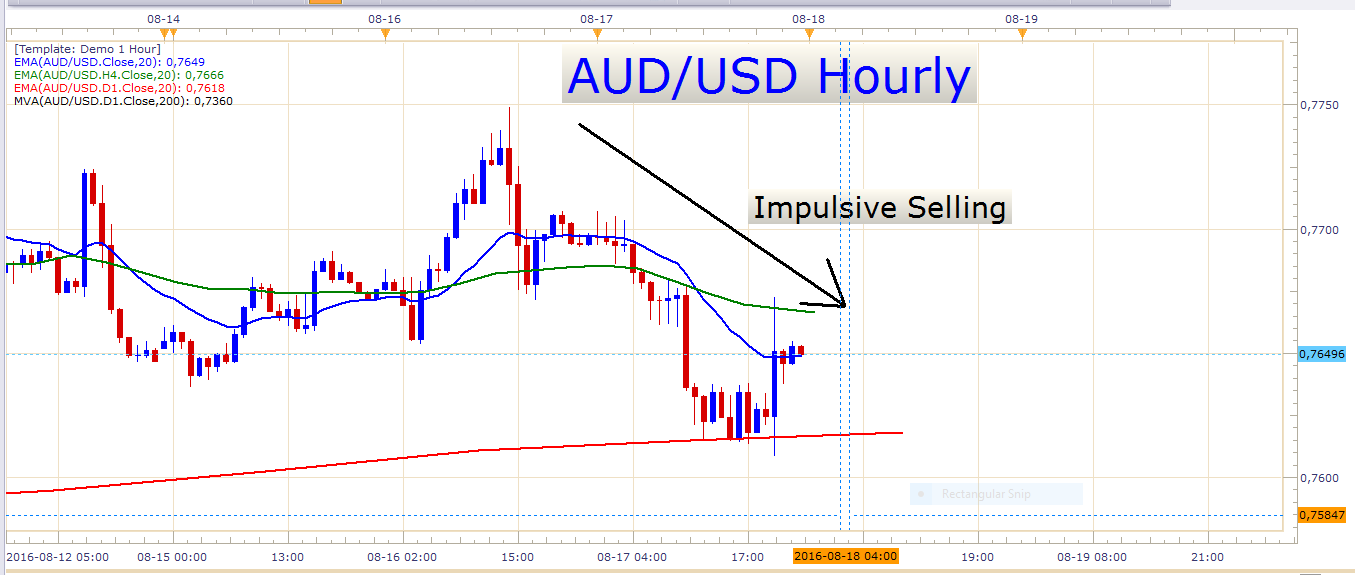
AUD/USD Hourly Chart
As you can see there has been some impulsive selling in the last two days. The FOMC meeting last night has caused the recent correction. Perhaps we will get splendid opportunities to sell this pair today. Perhaps a few pullbacks to the 20 exponential moving average, or even the 20 EMA (4-hour data source).
USD/CAD
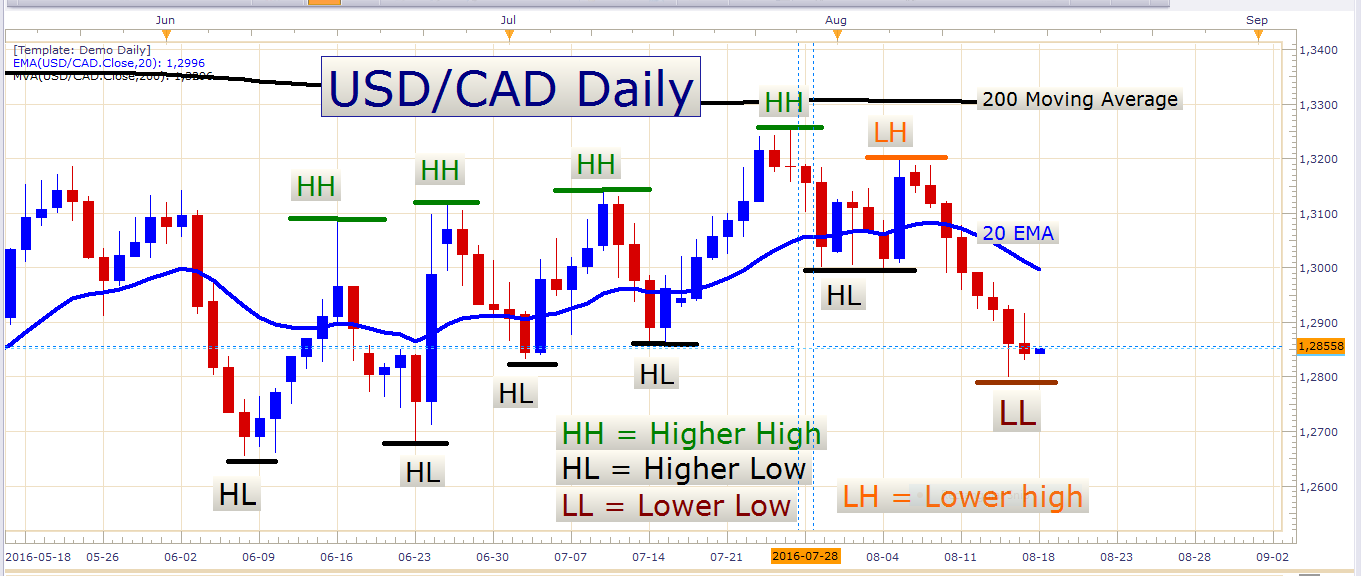
USD/CAD Daily Chart
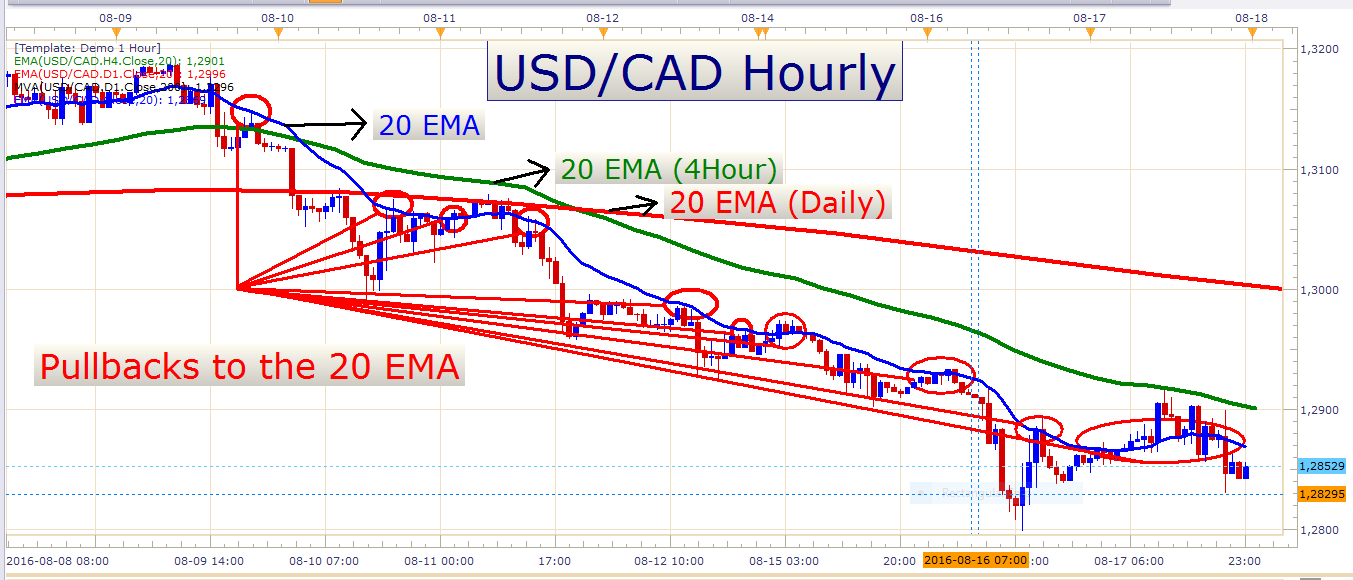
With the recent oil price rip, it is no secret why the USD/CAD has posted its eighth consecutive bearish day yesterday. I am always careful to chase moves like this as the bears might become exhausted soon. Many times you will get a better deal if you wait for a retracement before engaging in a short position. From a cyclical point of view, if a currency pair rallies or declines for 8 or 9 days in a row, the probability of a correction becomes greater and greater, and your chance of making a profit by chasing the price becomes smaller and smaller. Nevertheless, let’s look at an hourly chart to see how the 20 EMA has kept on providing good entry levels for short positions:
USD/CAD Hourly Chart
Economic data releases today
Concerning today’s economic calendar, there are a few important releases to watch namely the Australian employment numbers at 01:30 GMT. Later in the day, we have UK retail sales figures at 08:30 GMT which may be a good market mover. The last batch of data out of the UK was better than expected, so it will be interesting to see what we get out of the region today. Then we have European CPI numbers at 09:00 GMT. After that, we have the US Philadelphia manufacturing numbers which are released at 12:30 GMT.
Have a pip-filled day!
- Check out our free forex signals
- Follow the top economic events on FX Leaders economic calendar
- Trade better, discover more Forex Trading Strategies
- Open a FREE Trading Account
