The Canadian Dollar is Treading Down the Greenback while the AUD/USD is Still Capped by the 20 EMA
Friday was quite an interesting day in the forex market. The US NFP numbers came in short of expectations and the unemployment rate rose to 4.9% while only 4.8% was expected. This caused an impulsive selloff in the US dollar which lasted only a few minutes on many major pairs. On some pairs, the dollar recovered all of these losses, but the Canadian dollar overpowered its US counterpart until the end of the trading day. Let’s take a look at the USD/CAD:
USD/CAD
 USD/CAD Daily Chart
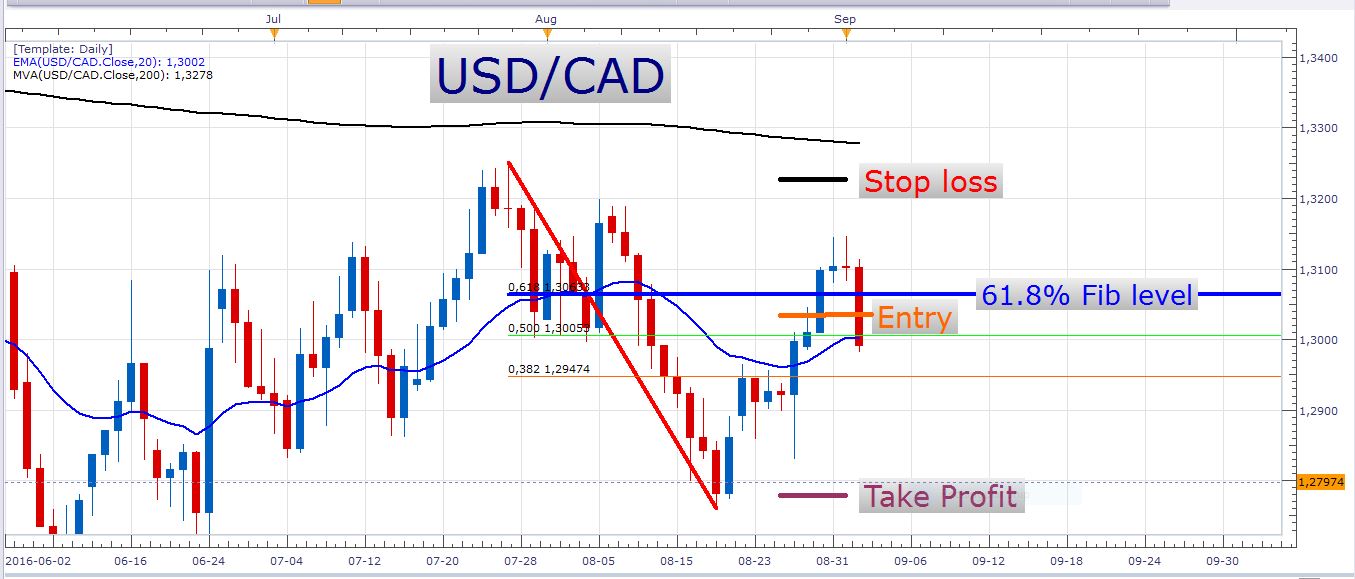
This is a trade setup I posted last week. This was a good setup and the trade is sitting at a profit of about 40 pips at the moment. I also suggested another more conservative short entry at 1.31500 which unfortunately missed the price by a mere 2.1 pips! This would have been a very juicy trade indeed. Well, this is forex trading and missing opportunities like this is part of the game, isn’t it? At least the aggressive entry was triggered.
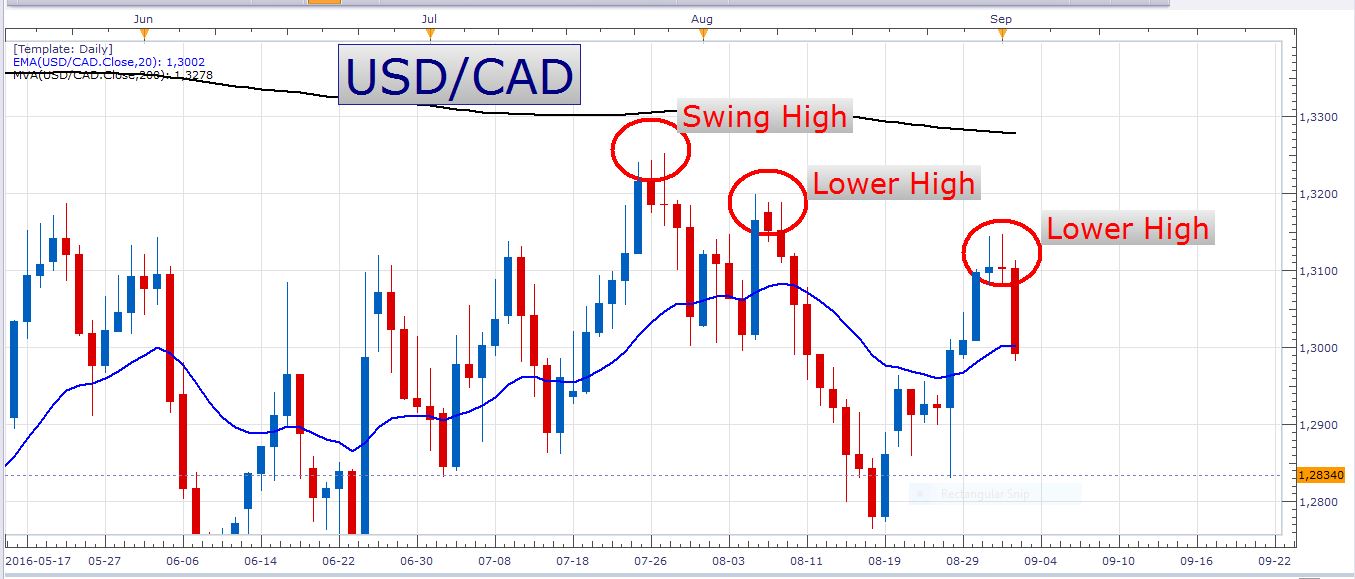
On Friday we saw the oil price pick up somewhat. This also helped the Canadian dollar on the day. What I like about being short the USD/CAD is that we had a firm close below the 20 EMA on Friday. I am always more comfortable when the price is below this exponential moving average when I’m in a short position. This tells us that the short term momentum is bearish and that more downside could be on the horizon. To give you a bit more perspective, this pair is trading well below its 200-day moving average which tells us that this pair is considered by the investment world to be in a downtrend. Something else to keep in mind is the fact that the recent swing high is indeed a lower high, with two recent swing highs preceding it. Look at the chart below:
USD/CAD Daily Chart
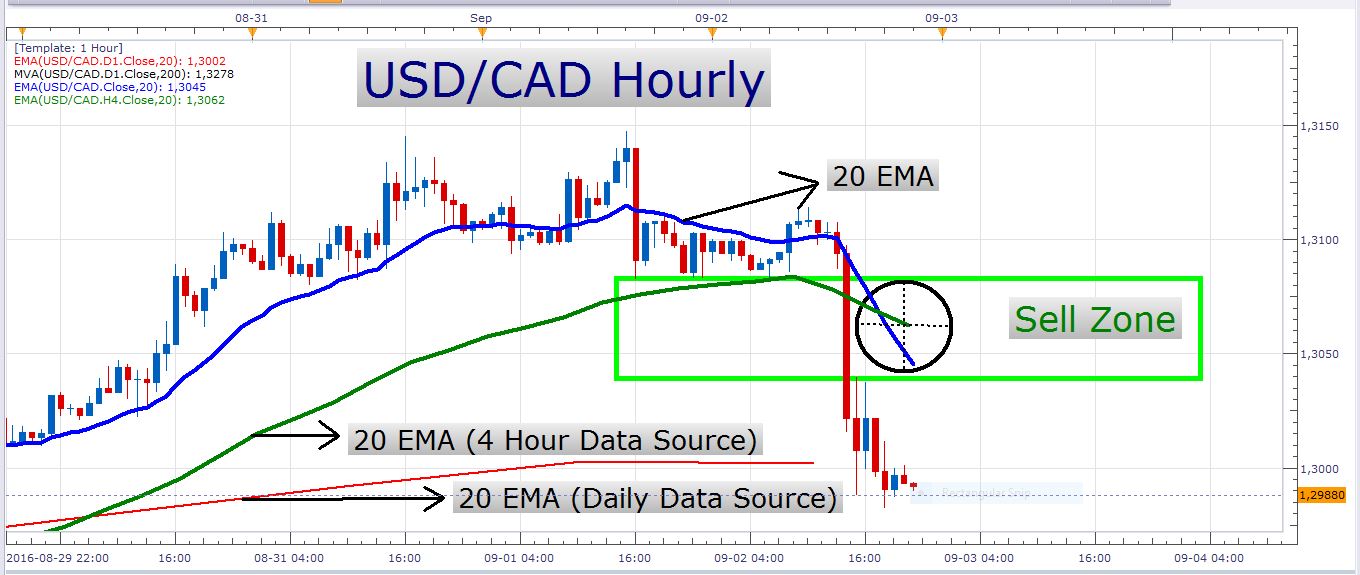
Now perhaps you are wondering how you can take advantage of this recent Canadian dollar strength. You can, of course, take entries off the daily chart, but another way to play it is on an hourly chart by waiting for a retracement. As you may know by now, I like taking entries close to the 20 EMA on an hourly chart. This keeps me from chasing the price and provides me with a much higher probability trade setup. Price chasers are often disappointed when the price pulls back soon after they’ve entered a trade. They need to use much wider stops which greatly reduces their chances of being profitable. Let’s look at an hourly chart of the USD/CAD:
USD/CAD Hourly Chart
USD/JPY
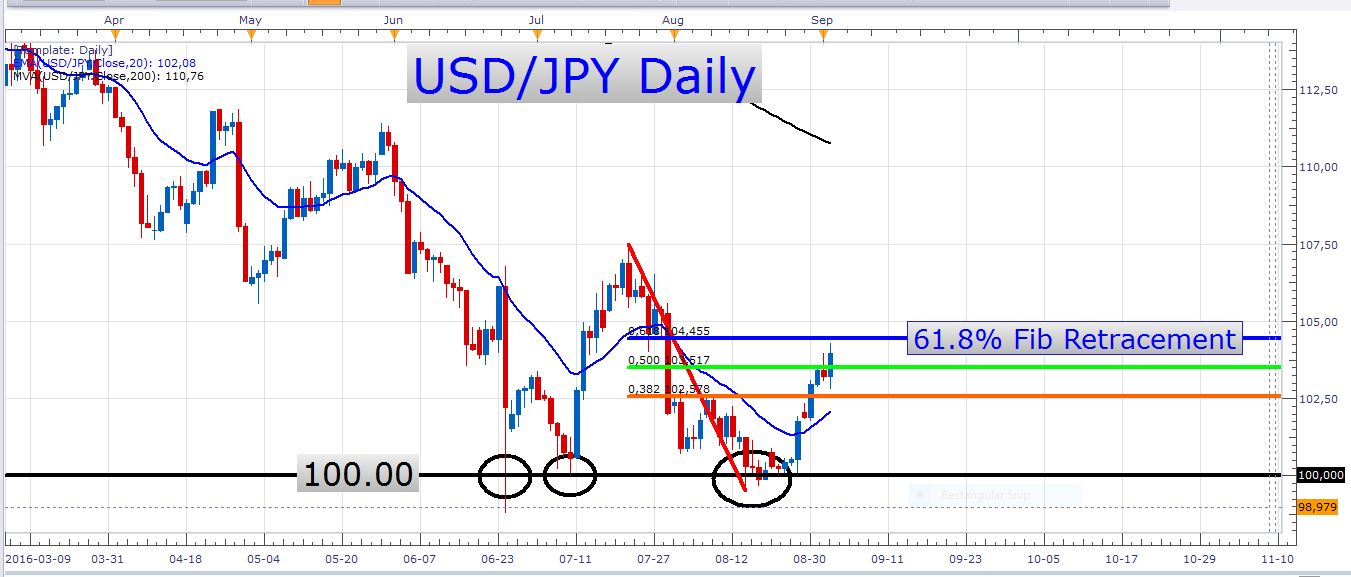
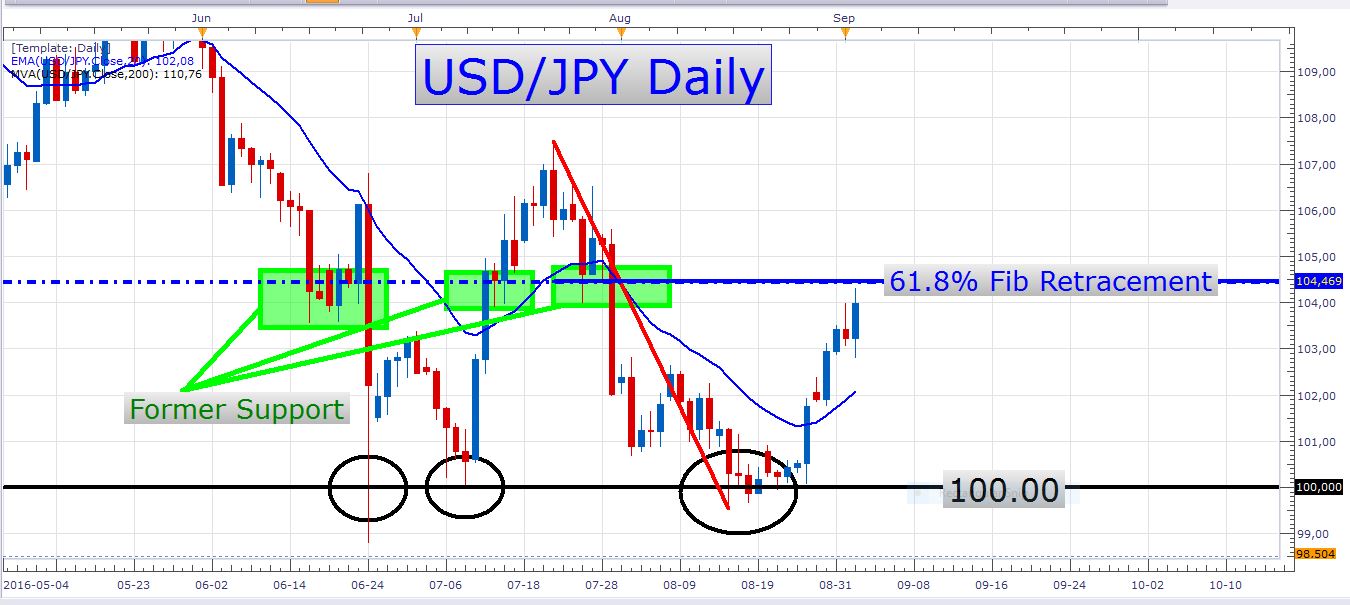
This pair has been one of the most interesting to watch lately. The big 100 psychological level has been rock solid support, and the price has deflected off of it several times since the 24th of June. I personally thought that this level would eventually fold, and perhaps it will, but at the moment the price is allergic to this level and trading far from it. Let’s look at a daily chart:
USDJPY Daily Chart
The current momentum on this pair is clearly bullish. Just how long this momentum will last is not clear, though. Especially when we consider that the current price is pretty close to the 61.8% fib retracement displayed on the chart above. Price came really close to this fib level on Friday, but it looks like there were a couple of sell orders parked in its vicinity which pushed the price down slightly. If you are considering a short position on the USD/JPY this could be an important level to observe. What I also like about this level is that it lines up pretty well with former support zones which could act as new resistance. Look at the following chart:
USD/JPY Daily Chart
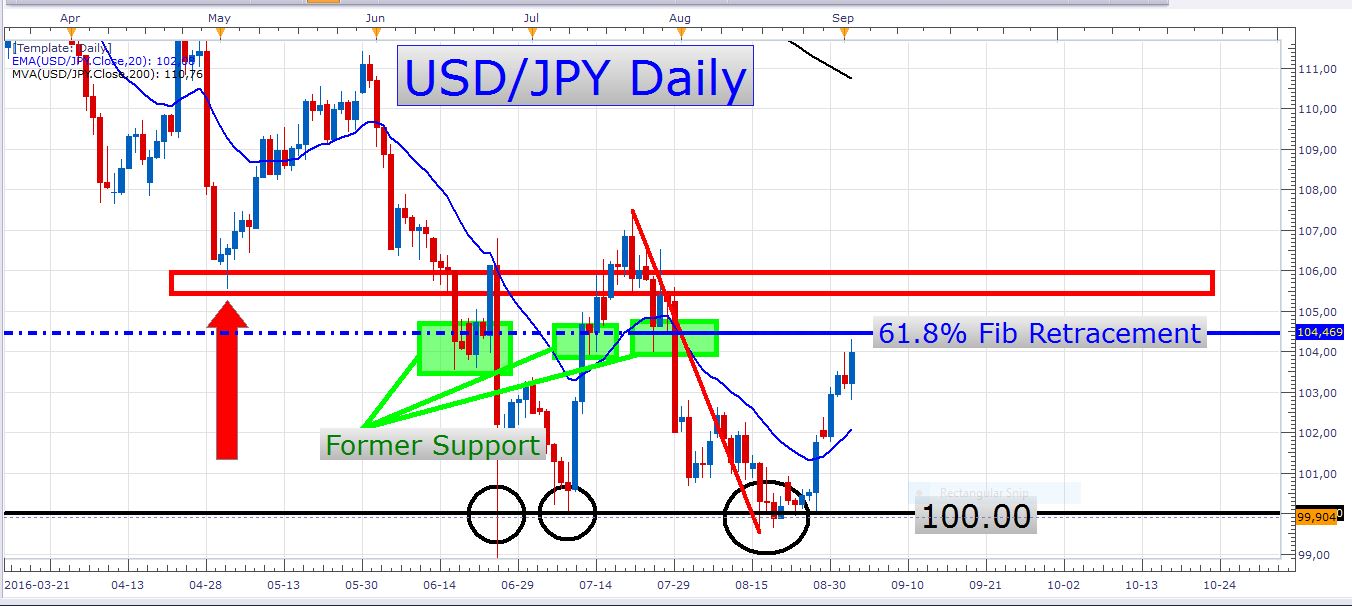
The green boxes mark zones where support was previously found. These levels of support often turn into new resistance after the price has broken through it. Perhaps the combination of the very important 61.8% fib number and these former support levels could be a potent recipe for a good short position. Just remember that there is a more important level of former support at 105.549. Look at the red arrow in the following chart:
USD/JPY Daily Chart
This level can be used as a more conservative level to enter a short position at.
AUD/USD
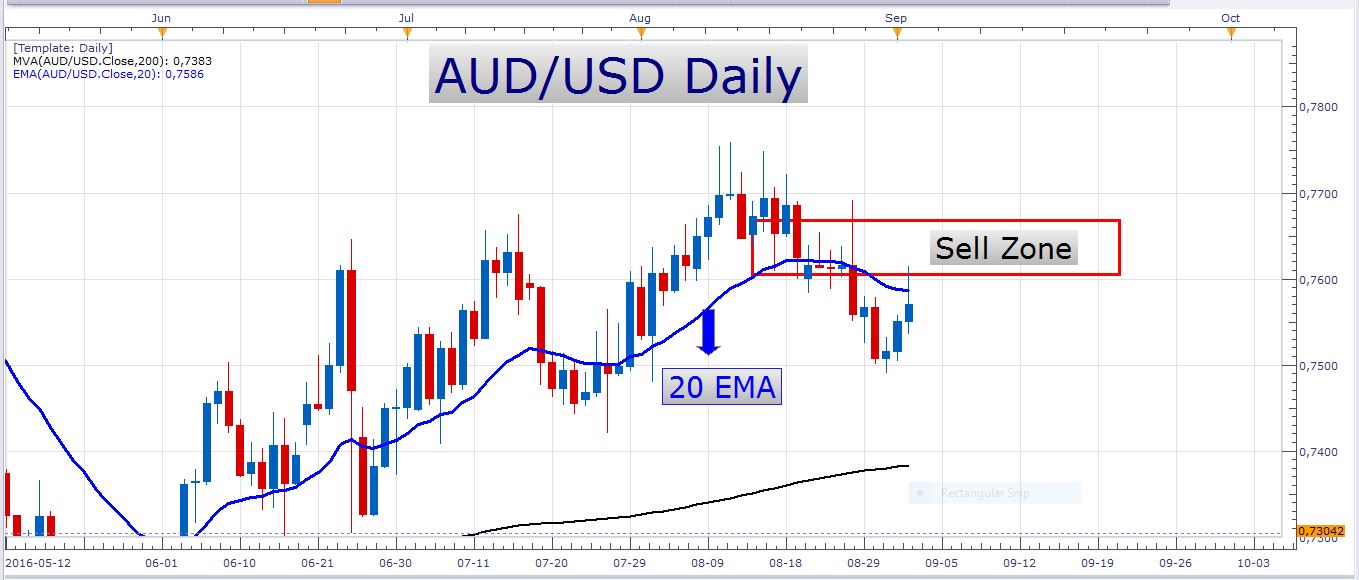
On Friday the AUD/USD briefly traded into the sell zone I mentioned last week. Let’s look at a daily chart with this zone:
AUD/USD Daily Chart
At one stage I didn’t think we would get a retracement into this sell zone. Especially after last Tuesday’s aggressive selloff. Nevertheless, we got that retracement, and anyone with an entry at the bottom of the sell zone would have gotten a very neat entry. Even an entry at the 20 EMA would have been a good entry. As you can see price closed firmly below the 20 EMA on Friday, and the rather long wick that was formed also creates the idea of sturdy resistance being in place. I remain bearish on this pair and perhaps traders who missed the spike into the sell zone might get another opportunity to catch a short position in this area. I am also still holding on to my short positions on this pair.
Tomorrow is Labor Day in the USA and Canada, so do not expect a very active day in the markets. Volatility might be possible, but definitely not probable. Thin market conditions sometimes make trading very tricky, especially intraday trading.
Have a profitable day!
- Check out our free forex signals
- Follow the top economic events on FX Leaders economic calendar
- Trade better, discover more Forex Trading Strategies
- Open a FREE Trading Account
- Read our latest reviews on: Avatrade, Exness, HFM and XM
Related Articles


Sidebar rates
Related Posts
