The Pound is Failing At Resistance. At Last the Bears Have a Tradable Setup On Their Plate
UK economic data has been very impressive these last few weeks. Today was no exception with August’s services PMI shattering expectations with a reading of 52.9. The forecasted number was 50. The difference with today’s stellar reading was, however, that the resulting bounce in the pair had no follow through like with many of the other recent releases. The pair made a 50 pip pop but lost that same 50 pips in less than one and a half hour’s trading. Perhaps today’s illiquid market conditions played a roll. Or should we perhaps draw the conclusion that the pound is getting a bit exhausted? If we look at the technicals, the pair is trading at important resistance levels where some exhaustion could very well be expected. Let’s look at a two daily charts of the GBP/USD:
GBP/USD
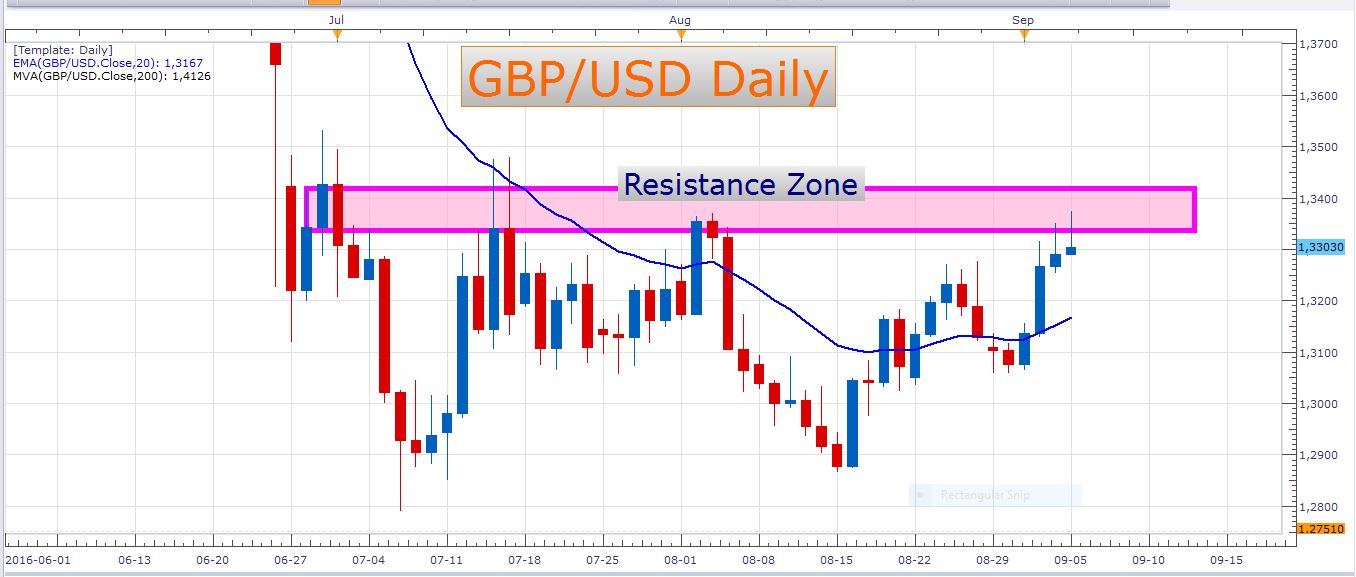
GBP/USD Daily Chart
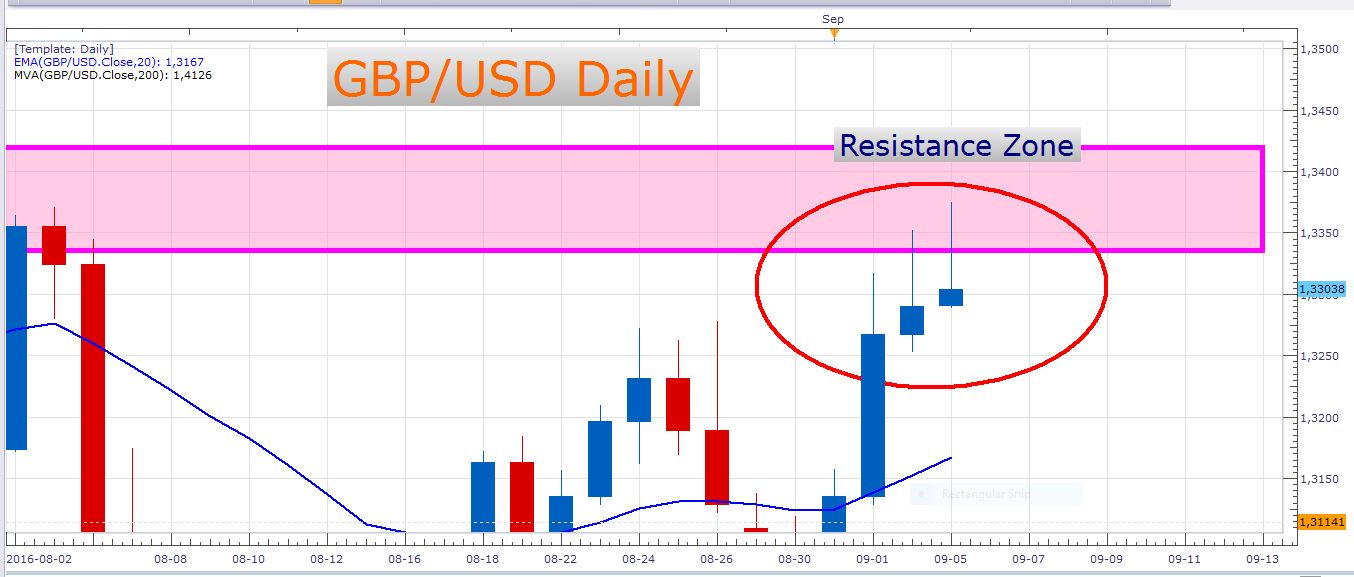
GBP/USD Daily Chart (enlarged)
I am really fond of the upside wicks of the last three daily candles. The last candle (today’s candle) is the one that especially appeals to me. For those of you who are new to the trading world, we call this a shooting star or a pin bar candle. It is also a reversal candle which is often a good sign that price is in the process of turning around. A shooting star often carries more predicting weight when it is formed at the end of an extended bullish move like we see in the charts above. When a shooting star candle occurs at an important resistance zone like it currently has, it just adds to the probability of the trading setup. Notice how the current market price is quite far from the blue 20 EMA (exponential moving average). This is where you want to trade a shooting star. Short entries may be taken at the current market price by aggressive traders. Conservative traders would probably want to enter at, for example, either the 50% or 61.8% fib retracements of today’s daily candle. A stop loss could be placed about 45 pips above today’s high, and a take profit at about 1.31380 which is roughly in the middle of the large range that has been formed lately.
AUD/USD
Although I have written about this pair numerous times in the last few weeks, it is important to look at it today seeing that we have an interest rate decision by the RBA tomorrow, as well as second quarter GDP numbers on Wednesday.
If we look at the technicals of the pair, the outlook remains negative, although it is less negative than a few days ago. It seems like the path of least resistance might be to the downside over the next few days. The last seven trading days have all formed wicks that pierced the 20 EMA, but could not close above it. This is the technical aspect of the pair.
When we look at the fundamentals it becomes more tricky, however. It is widely anticipated that the Reserve Bank of Australia will leave their current monetary policy unchanged at tomorrow’s meeting with no rate cut being expected. This could definitely strengthen the Australian dollar. The other positive factor is the region’s GDP (Gross Domestic Product) that has been growing lately. The next GDP release which is on Wednesday is also expected to be higher than the previous reading. So when we consider these fundamentals, caution should be warranted to the bearish market players (like myself). Perhaps you might want to bring your stop loss(es) to break even (if you entered high enough), or use some other means to curb your risks on this pair. Also, consider that we have some important economic data out of China later this week (CPI and trade balance figures) which could also have a notable effect on the Australian dollar. The Australian dollar is considered to be a commodity currency, and China is their largest trade partner which consumes vast quantities of their materials. Therefore the condition of the Chinese economy has a great effect on Australia, and subsequently on their currency. Let’s look at a daily chart of the AUD/USD:
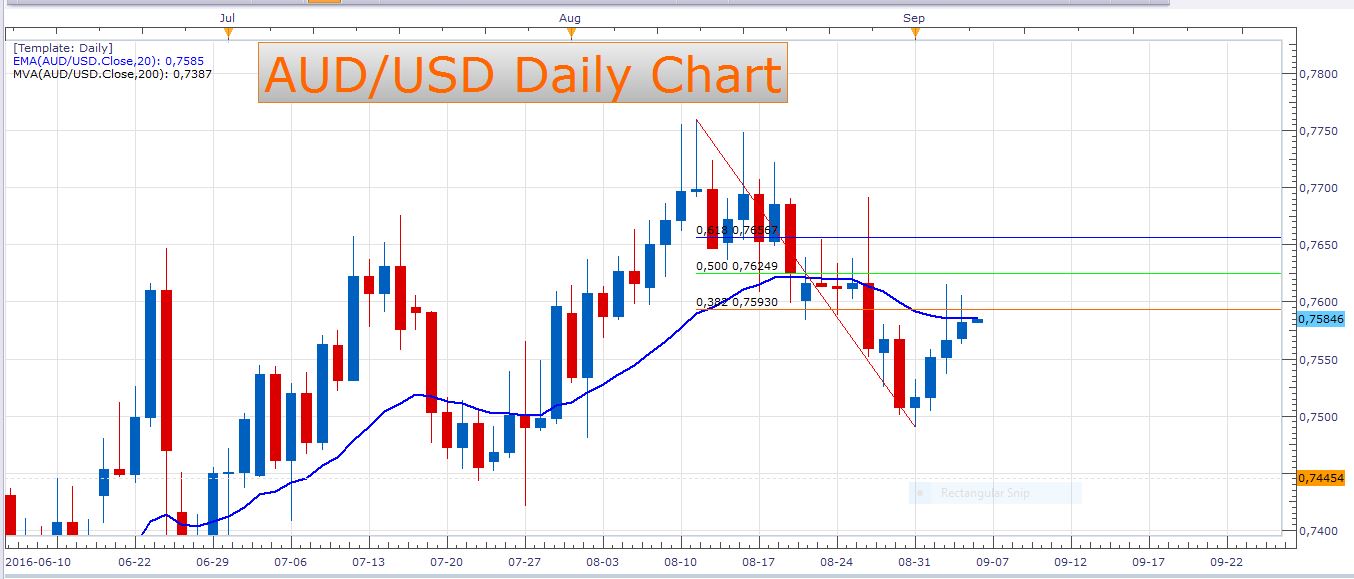 AUD/USD Daily Chart
Gauging from the looks of this chart we could say that a lot of strength would be needed to drive the pair through the adjacent resistance. Just look at how many recent candles have long wicks to the upside.
USD/CAD
The USD/CAD remains a splendid short play. The Canadian dollar is currently very strong and despite the quiet day in FX, it still managed to gain more than 50 pips against the US dollar.
That’s all for now, fellow traders!
- Check out our free forex signals
- Follow the top economic events on FX Leaders economic calendar
- Trade better, discover more Forex Trading Strategies
- Open a FREE Trading Account


