In the last few days, there have been some substantial moves in the forex market. The ECB (European Central Bank) did its part in providing some fuel for the action, but the main reason has been the fear factor. The forex market is fearing the FED might hike the interest rates by 25 bps (basis points) so the forex trades have been closing the long Euro position and the short USD positions.
If you haven´t come across these terms (long and short positions) then you are new in this business and batter have a look at our FXML forex course to get to know the basics at least. If you have the required talent then you can progress further into becoming a professional forex trader with our course and our market analysis which are usually provided by me and my colleague Eric in our forex blog, market updates and weekly/monthly analysis.
Support and resistance levels are one of the most important indicators in forex among 3-4 others. So, if you can´t spot them by yourself then here we are with support and resistance levels for some main forex pairs. So, let´s have a quick look at them before they become history.
EUR/USD – While the other major pairs were giving signs of a reversal on Wednesday, this forex pair showed resilience until the ECB meeting was over on Thursday afternoon. But since then the price has moved more than 100 pips down from the top, so the support and resistance levels have changed.
Now the first resistance level comes at 1.1250-60 which is where the 50 moving average stands on the hourly forex chart. Above there comes Friday´s high at 1.1280s and then the 1.1330 level is a strong long term resistance level.
The first support is provided by the 200 smooth moving average on the hourly chart which stands at 1.1220. Last Friday´s low at 1.12 is the second support level, but the real support level which separates the upside from the downside is 1.1120-30 which has held the price above in the last two weeks.
GBP/USD – This forex pair has moved down in a steady fashion since topping out at 1.3440s on Tuesday evening. The down move has been unwinding in perfect waves, the bottom of which provide the resistance levels, aided by moving averages.
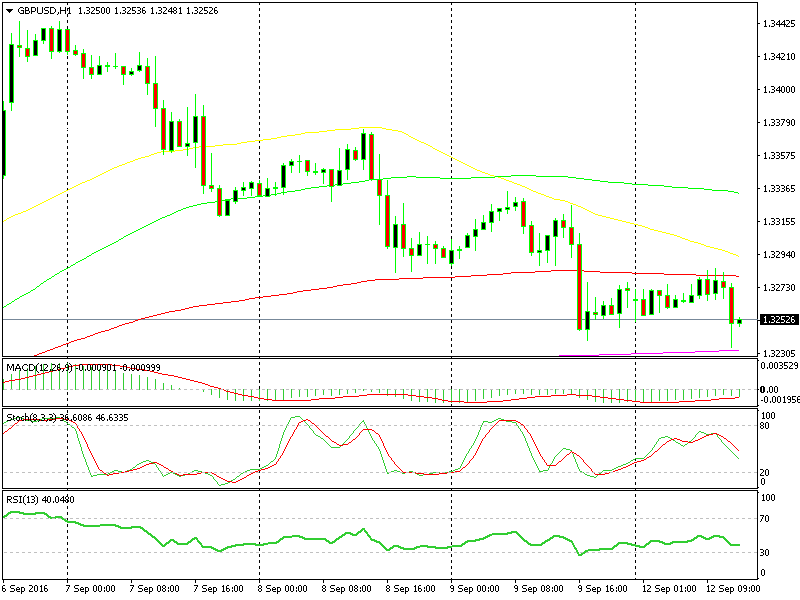
Support and resistance levels and moving averages do a good job together
These levels stand at 1.3280 (100 smooth average), 1.3320s (50 moving average on Friday) and 1.3370-80 (50 moving average on Thursday). The first support level is provided by the 200 smooth moving average on the hourly forex chart at 1.3230-40 which is the low on Friday and today as well so far. Below that comes 1.32 and 1.3150. So, use these levels if you are planning on trading these two pairs, but as always, trade safely and don´t bet your house on them or any other indicator for that matter.