All The Major Pairs Are Still Stuck In Ranges. The Pound Is Sinking and The Yen Is Climbing
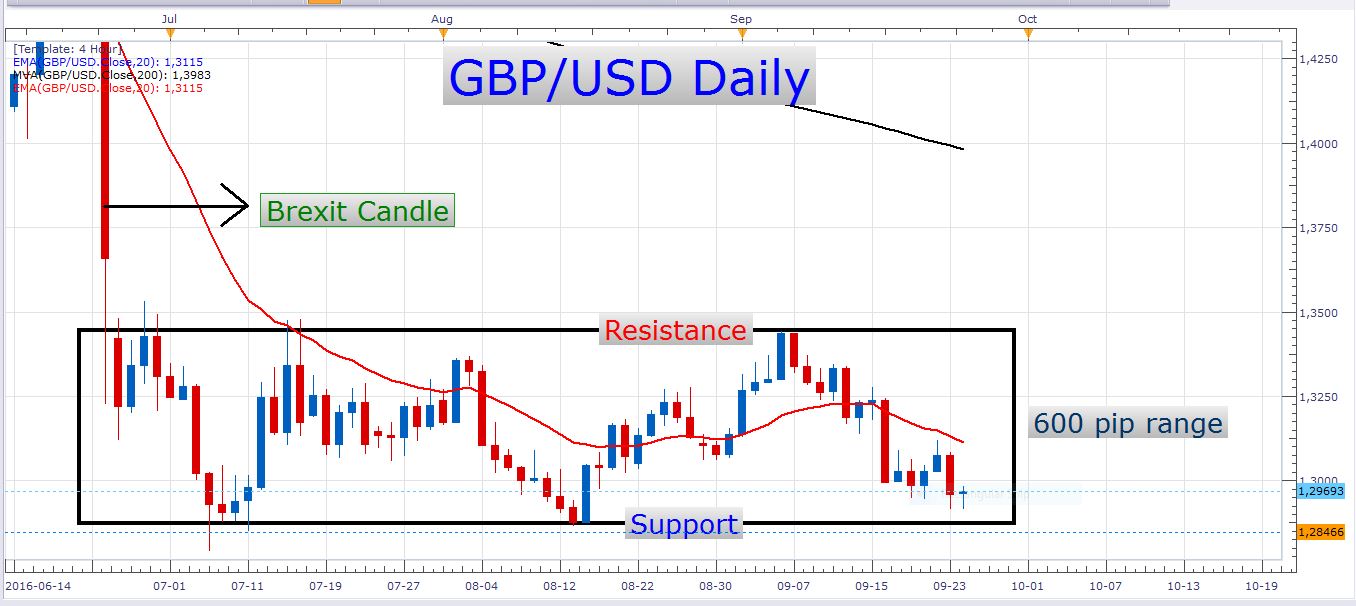
The British pound has really taken a beating lately. For more than two years the pound has been declining against the US dollar. When the Brexit was confirmed the pair declined more than 1100 pips on the day, and after that, the pair traded lower some more to where it is now, at 1.29700. With all the great fundamental catalysts that have influenced the pound lately, it is somewhat strange that the pair has been in a consolidation phase for the last 65 trading days. Look at this daily chart:
GBP/USD Daily Chart
Here you can see how the pair moved sideways for many days. In this range, we’ve seen both aggressive buying and selling take place. At one stage it looked like the pair was going to break the range resistance when a series of five consecutive bullish candles appeared, with the last candle closing basically at the high of the day. The next day the pair sold off, however, and since then it’s been declining steadily. At the moment the exchange rate is not far from the yearly low that was set on the 6th of July. The price is also close to the range floor where an important support zone is situated.
With the recently renewed fears of the possible negative effects of the Brexit, the outlook for the pound is just getting worse and worse. With all this said, it looks like the GBP/USD could perhaps break through its range floor soon. Of course, it might take a massive fight between the bears and the bulls for this support level to fold, but if the larger downtrend reasserts itself, this level will necessarily come under deadly pressure soon. On the other hand, if for some reason the US dollar underwent a significant weakening, and investors attached more value to the pound, the GBP/USD might be in a position where market players could keep it afloat in the near future. Sometimes large institutional market participants buy into an asset at times when it’s widely considered to be a bad deal. However, although this could be a possibility, my personal bias remains bearish as long as we remain in this range and the British economy remains vulnerable.
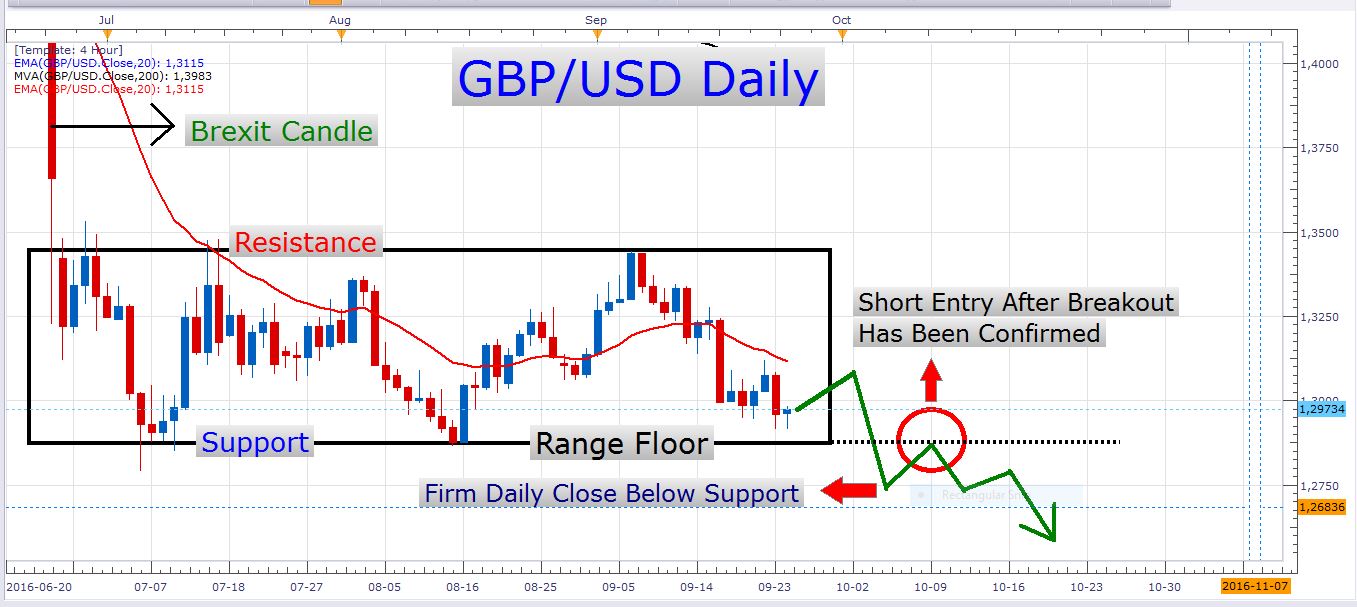
This range in which we find ourselves must, and will eventually break. If we wait for the breakout to happen before we enter a trade it could save us the disappointment of trading long or short at the wrong time. Let’s go to the daily chart again:
GBP/USD Daily Chart
So let’s say the pair breaks out lower sometime soon. The confirmation would be a solid daily close below the range floor. Some traders like to enter trades when the actual breakouts occur. This has its advantages, but sometimes it is wiser to wait for a retracement to take place after the breakout has occurred, before entering a trade.
USD/JPY
USD/JPY Daily Chart
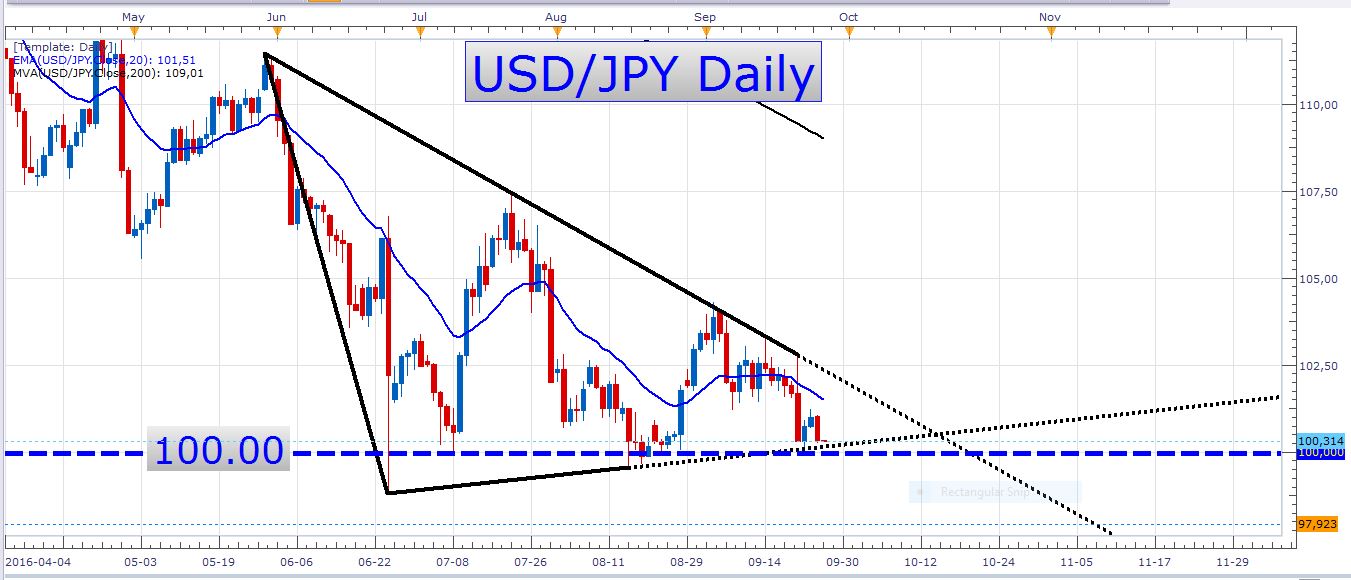
In this chart, you can see that the bears are renewing their onslaught on the big 100.00 psychological level. I wrote about this pair on Sunday evening and suggested to wait for a breakout-retest setup (the same type of setup as with the GBP/USD) to take place. At the moment it looks like this type of setup could come into play pretty soon. A move below this triangle’s floor could be a very exciting setup to seize, especially if we got a juicy pullback to enter a short position on.
Economic data
Tomorrow is a fairly light day in terms of economic data. The only two events that could possibly be market movers are a speech by the Bank of Canada’s governor Mr. Poloz, and the US CB Consumer Confidence numbers. Mr. Poloz speaks at 23:10 GMT and the US consumer confidence numbers are out at 14:00 GMT.
Best of luck with your trading!
- Check out our free forex signals
- Follow the top economic events on FX Leaders economic calendar
- Trade better, discover more Forex Trading Strategies
- Open a FREE Trading Account


