The Strong US GDP Release Supported the Buck Today. UK and Canadian GDP Numbers Scheduled For Tomorrow
Trend traders are starving in the current market conditions. There is a major shortage of strong tradable trends in the currency market at the moment. If we investigate the price action produced by the major pairs over the last few weeks, it is troublesome to see just how much time has been spent trading in ranges and consolidations. When the markets are chopping around with no distinct trend or direction, it makes trading much trickier than when there are strong trends prevailing. Let’s look at a few charts:
USD/CAD
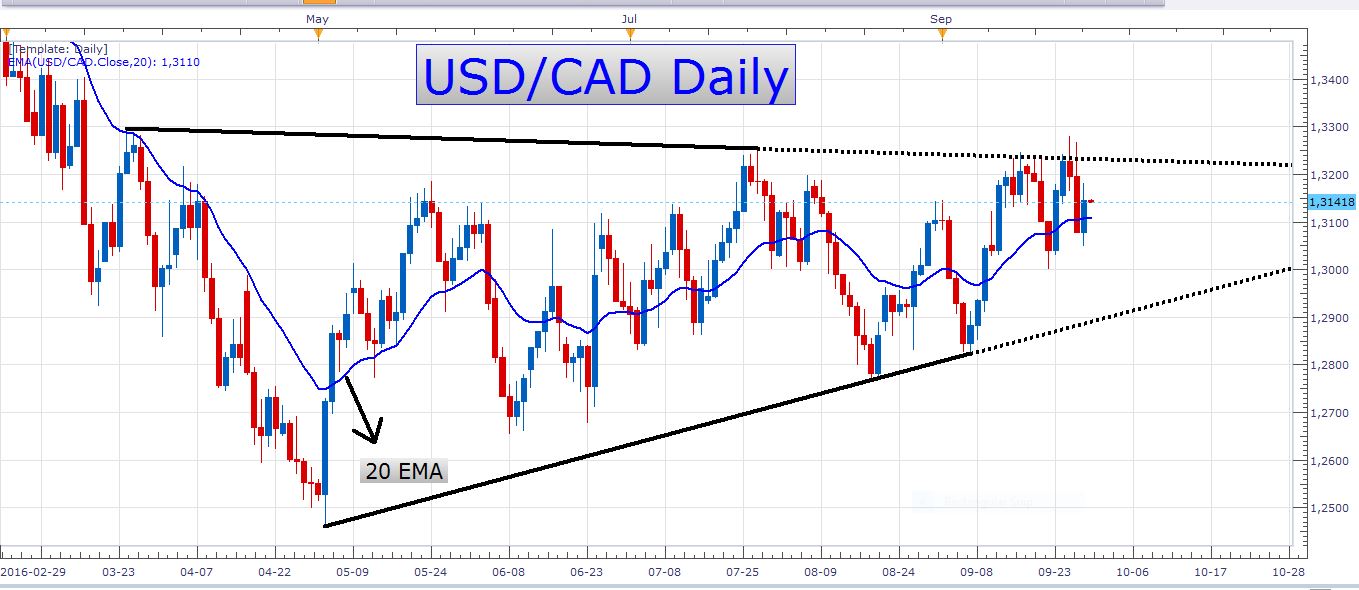
USD/CAD Daily Chart
Before we entered this consolidation phase, there was a very strong downtrend which prevailed. Back then it was easy to make money with that steady decline. This multi-month selloff was preceded by a massive bull run in the pair that lasted several years. At the moment, however, we are stuck in a rather frustrating range. Perhaps you are asking yourself why I’m saying that the pair is in a range while we’ve lately seen the formation of higher highs and lower lows. Well, if you look at the current price level, and the price of four months ago, the pair has not made any progress whatsoever. Yes, we have seen some wild swings, but we haven’t really seen the qualities of a good old strong trend. All we’ve basically seen is a lot of whipsaw-like price action.
The price has recently bounced off the upper boundary of the wedge in the chart above. It looks like we will only get a breakout closer to the apex of this triangle, though.
A few weeks ago I wrote about trading a breakout through the upper boundary of this wedge. I mentioned that I preferred buying a retest of the breakout, that is, waiting for a confirmation of the breakout, and then entering on a retracement close to the initial breakout level. In the above chart, you can see that the buyers attempted to conquer this resistance level but were unable to sustain their effort. The price made a false break higher and then sold off quickly. If you like to trade breakouts as they happen, you can learn something from this scenario – wait for a daily candle to close above the resistance zone before you enter your trade. If you had traded this pair, and you didn’t wait for this kind of confirmation, you would have been caught on the wrong side of this false break. Of course, we could get a real breakout out of this consolidation soon. If we consider the higher highs and lower lows that have formed lately, we could formulate a bullish bias from it. The possibility of a breakout lower cannot be ruled out, though, and this is why we want to see the confirmation of a bullish breakout first before entering a long trade. Retail positioning on this pair is slightly bearish, which supports my bullish bias on it. Remember that retail sentiment is used as a contrarian indicator to the price.
I am not interested in trading this pair on an intraday basis at the moment. The reason is the lack of strong directional momentum. I would rather wait for a breakout out of this current triangle formation before engaging in any trades. Of course, this doesn’t mean that you can’t take advantage of potential volatility by means of short- term trading. With the Canadian GDP numbers which are released tomorrow at 12:30 GMT, there could be some decent price movement to exploit. Traders who are acquainted with range trading can also trade this pair with range trading strategies. Just be careful of the Canadian GDP print tomorrow, as this could possibly shatter the range-bound price action we’ve seen on this pair lately if get a very big surprise with the release.
GBP/USD
GBP/USD Daily Chart
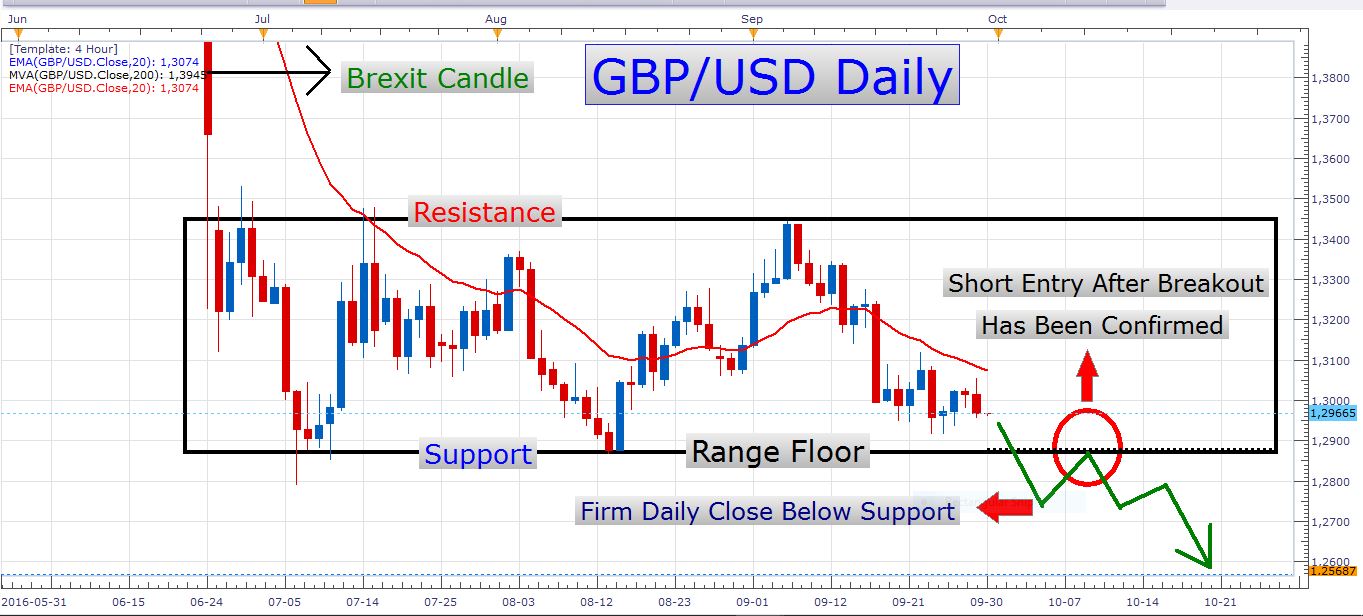
The GBP/USD is still trading close to an important support level. Tomorrow we have the UK GDP numbers out at 08:30 GMT. This event carries great potential to either strengthen or weaken the pound. I would still like to see a break below the range support, as indicated on the chart above. An entry on a breakout retest could be a prudent way to play this pair. The entry would be initiated at the swing point indicated in the red circle on the chart above, after a firm close below the current range floor has been established.
USD/JPY
USD/JPY Daily Chart
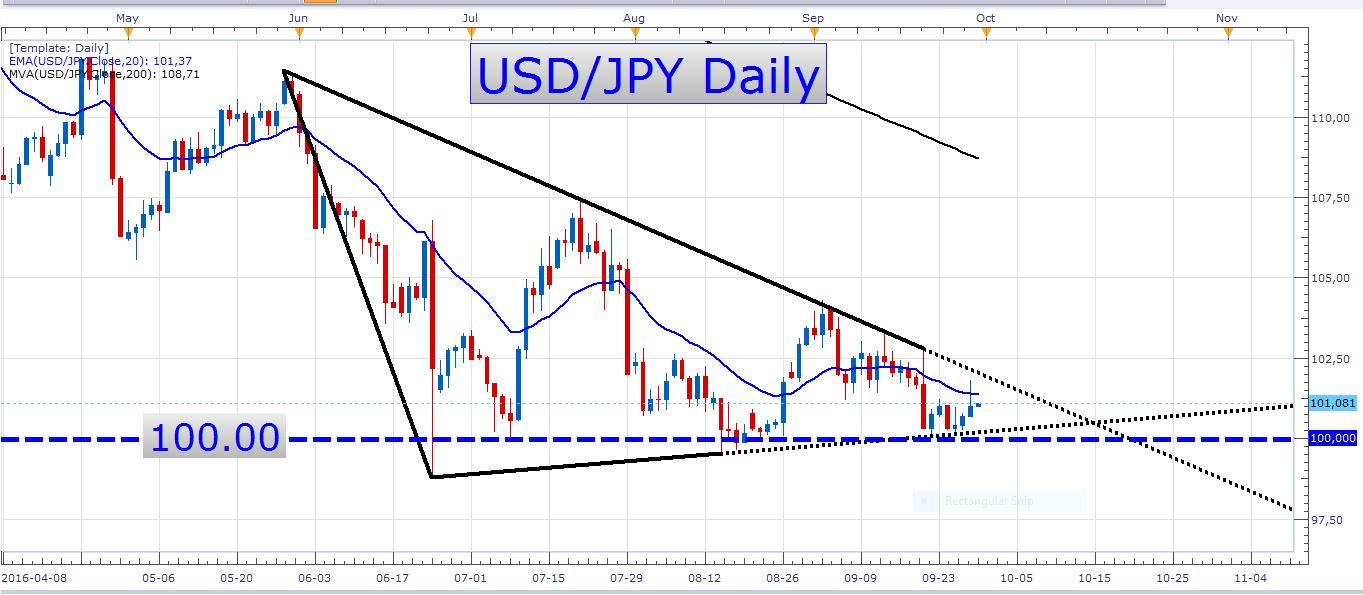
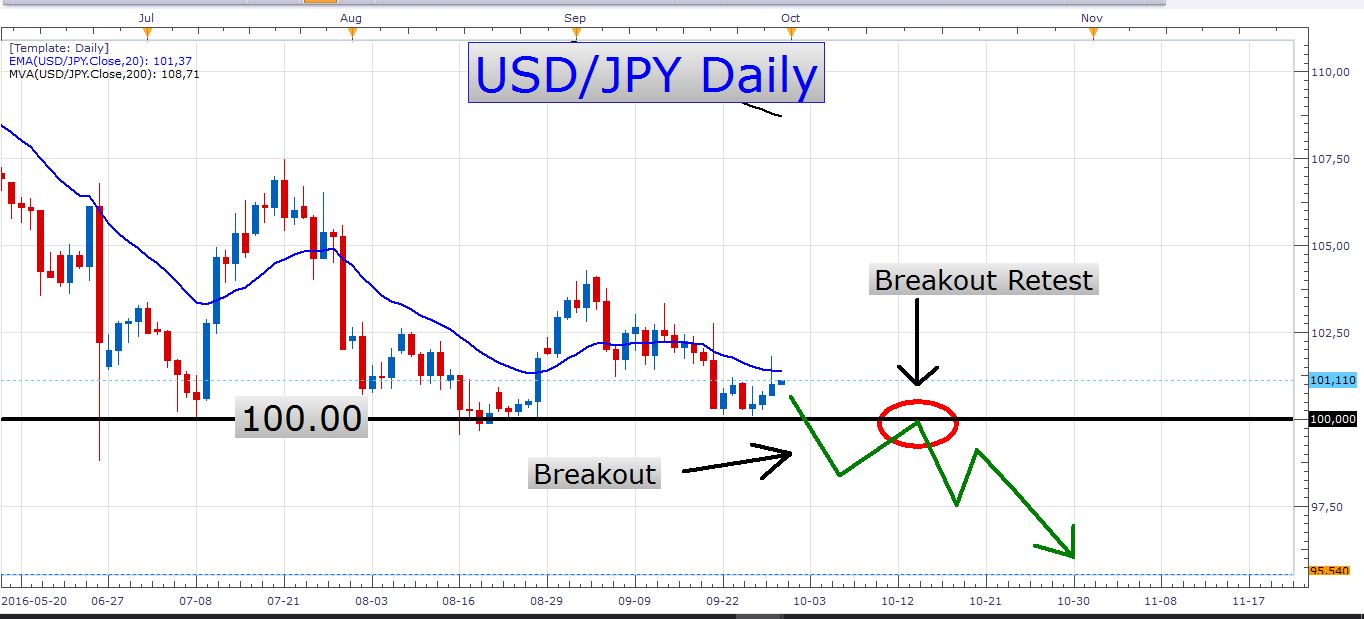
I am still very fond of the technicals of this pair. We are fast approaching the apex of this triangle. I love the fact that the triangle base is situated at such an important psychological level – the 100.00 level. The way I would like to trade this pair is similar to the GBP/USD setup. Look at this chart:
USD/JPY Daily Chart
Economic data
Besides the GDP releases tomorrow, there are some Chinese manufacturing numbers out early in the morning, with European CPI numbers out at 09:00.
Enjoy the trading tomorrow!
- Check out our free forex signals
- Follow the top economic events on FX Leaders economic calendar
- Trade better, discover more Forex Trading Strategies
- Open a FREE Trading Account
- Read our latest reviews on: Avatrade, Exness, HFM and XM
Related Articles


Sidebar rates
Related Posts
