Pound for Pound, the British Pound is the Hottest Currency to trade by Far!
With a range of almost 280 pips for today, the GBP/USD was, and is a very attractive pair to speculate with. Where there’s significant market movement, it is normally much easier to make money with FX trading than in quiet markets. Today was one of those immaculate days to trade the pound. Where and when will the pound’s freefall end?
With the dark Brexit clouds hanging over the UK, it looks like the pound may continue to lose more and more of its value in the near future. During the last 25 trading days, the pound lost almost 10% of its value in dollar terms. This translates into a decline of about 1300 pips. Last week Friday there was a flash crash of almost 700 pips in the GBP/USD which happened in less than 10 minutes. This was during the Asian session when market participation and liquidity are normally much lighter than during the European and US sessions, which makes it the perfect timing for a flash crash to occur.
If you've read yesterday’s article, “Crude Oil Rips and the USD/CAD Dips” you might remember the following: “Keep an eye on the GBP/USD and pound crosses for short opportunities. The retail sentiment on Cable points to further losses in the exchange rate, and it is likely to offer larger directional moves than the other major pairs at this stage.”
This scenario played out perfectly today, as the GBP/USD lost about 217 pips in today’s trading. The other major currencies also enjoyed a massive strengthening against the pound today. Let’s look at a few charts:
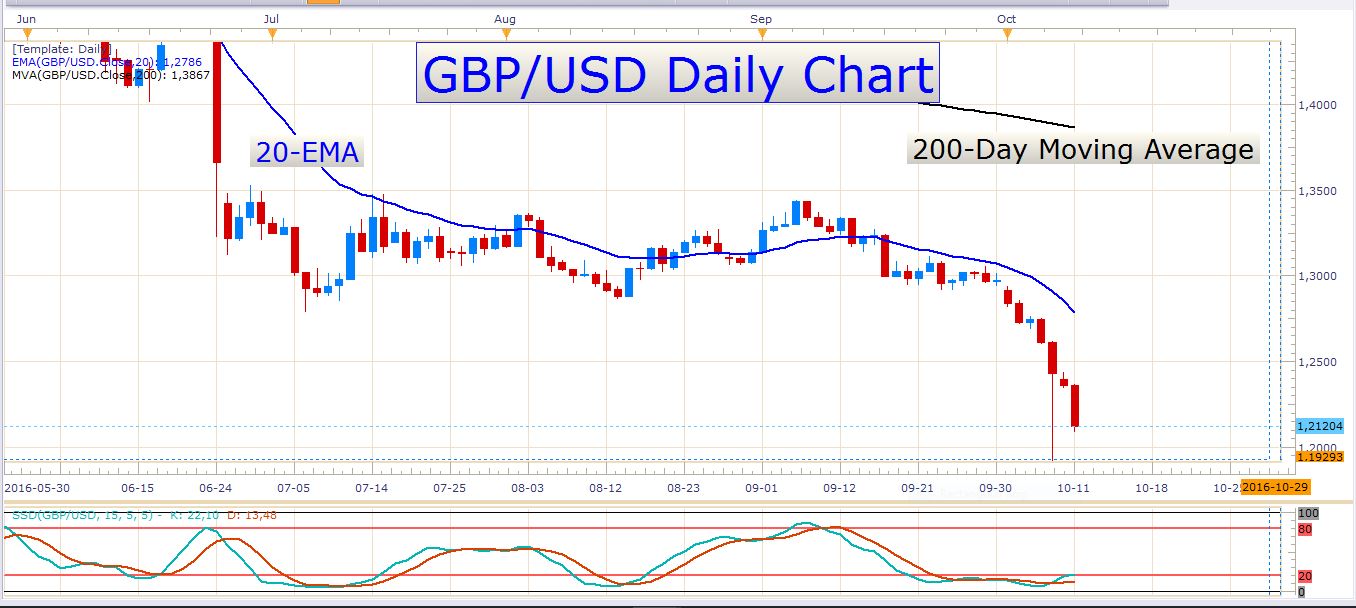
GBP/USD Daily Chart
The range that Cable found itself in a couple of days ago is done and gone! The current price is about 700 pips away from this range floor. It’s exciting to see a pair trade in a range for so long and then burst mightily through either the support or resistance. What happened in the GBP/USD, is not an uncommon sight at all. When a currency pair gets stuck in a consolidation pattern for an extended period of time like this, the resulting breakout is often very aggressive.
Here is an example of an actual trade on the GBP/USD which I took today:
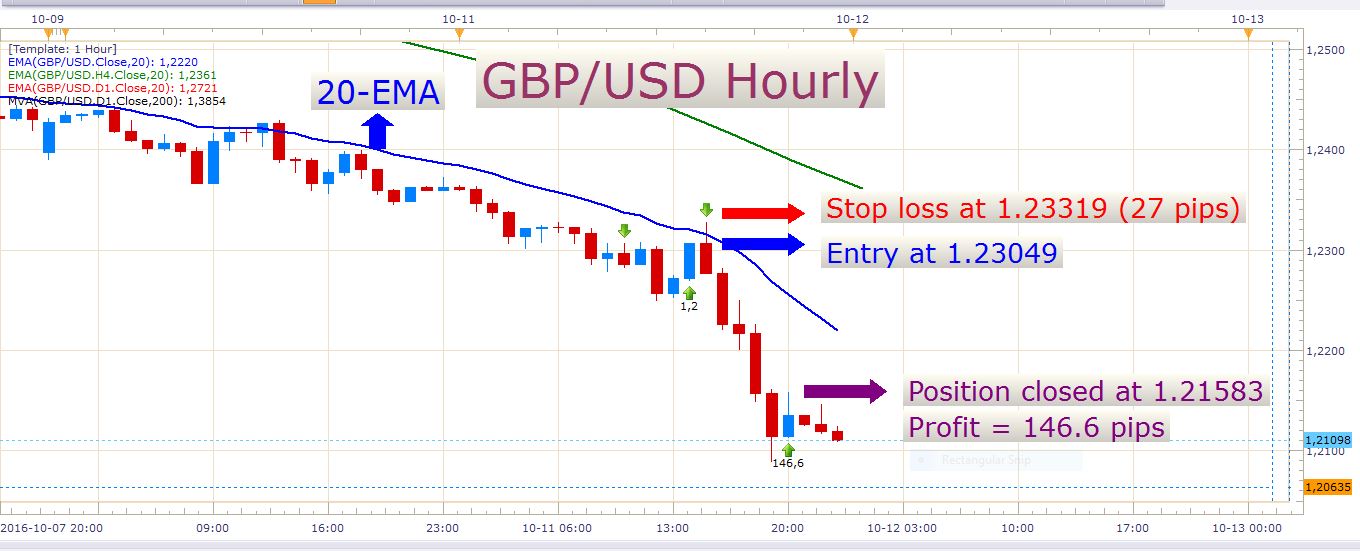
GBP/USD Hourly Chart
As you can see, the candle in which I opened the short trade pierced the 20-EMA, but was rejected off of it, and closed well below it. While the price started to retrace from above the 20-EMA, I placed a sell order about 5 pips below the market price. The idea was to catch some downward momentum which would trigger the entry order. The lot size was adjusted to risk slightly more than 1% of my account equity. The order got triggered, and a quick selloff commenced after this. I didn’t open the trade with a take profit order attached to it. The position was manually closed later in the day after the 5-minute chart revealed some signs that the decline was losing momentum. In this particular example, this short trade yielded a 5.71% gain on the account equity, while a mere 1.05% was risked.
EUR/USD
The EUR/USD performed poorly today and closed firmly below its 200-day moving average. At the moment it is coming down against trendline support which also forms the base of a triangle or wedge. The US dollar is really performing well lately, and if its strength continues over the next few days, the EUR/USD might come under further pressure. Look at the following chart:
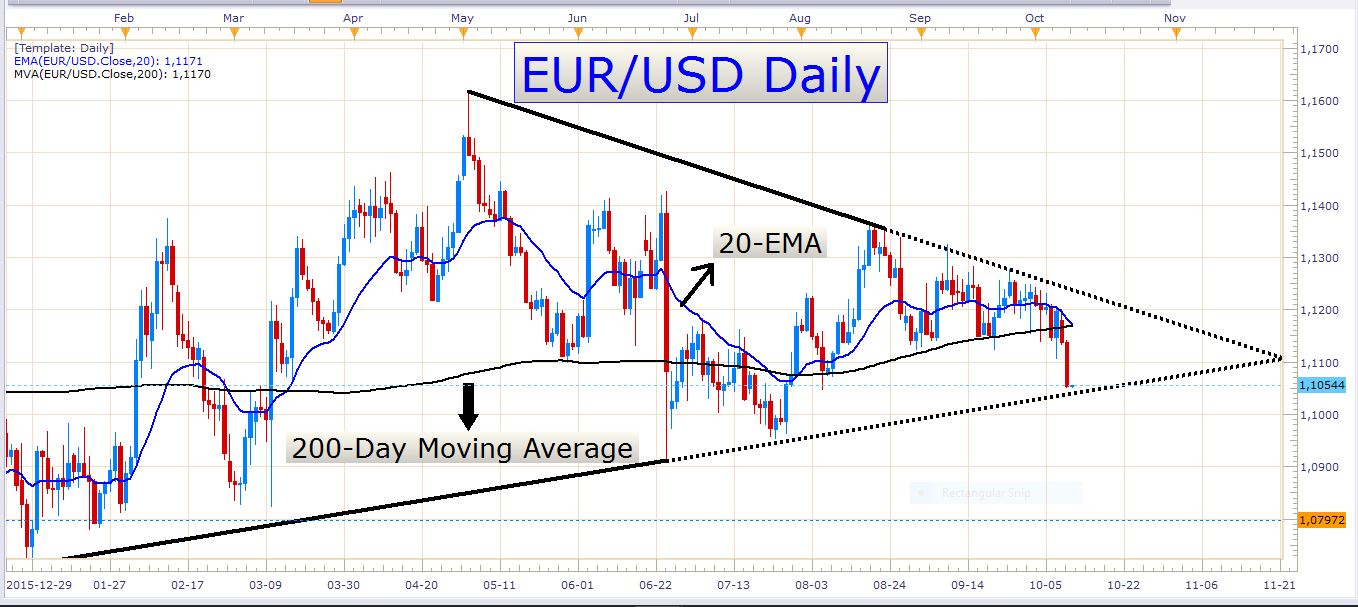
EUR/USD Daily Chart
As you can see, the recent selloff has brought the pair into a rather oversold state. I would certainly not enter a short trade here because the recent move is too extended to my liking. It is better to wait for a retracement to occur before entering a short trade.
As you know, there has been many political and financial uncertainties surrounding the European Union, and if some more of this surfaced soon, the Euro could take a further beating.
USD/CAD
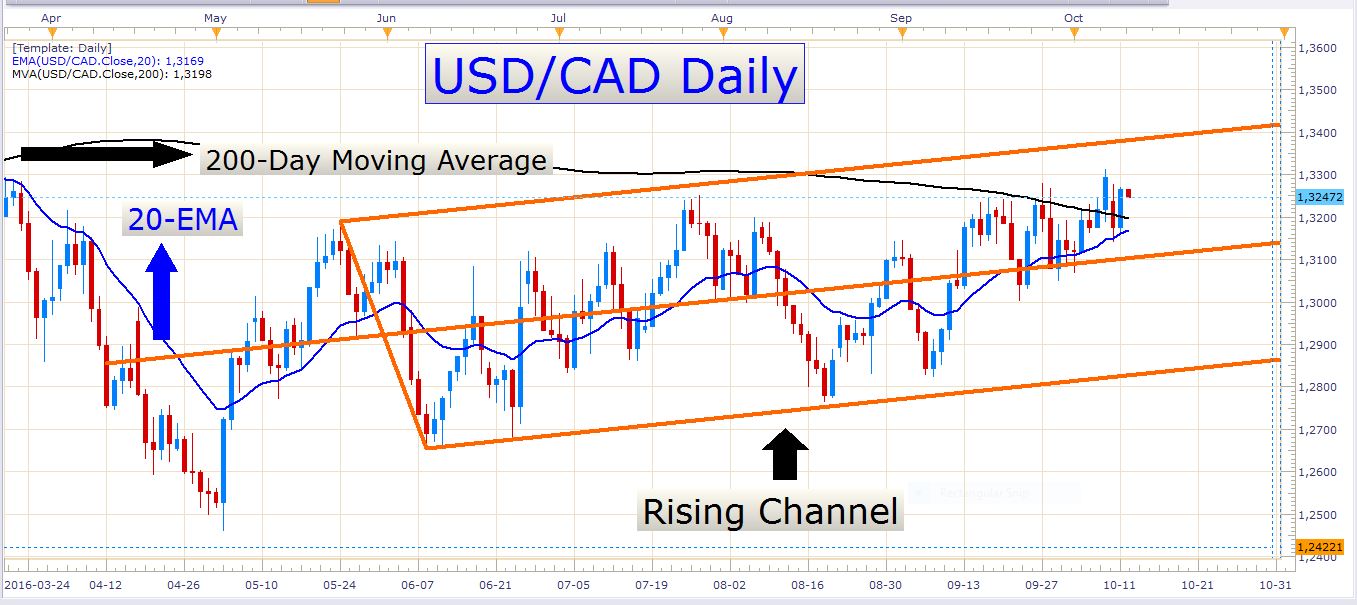
USD/CAD Daily Chart
Once again, we find ourselves above the 200-day moving average. Yesterday I commented about the support that the 20-EMA (the blue exponential moving average) offered to the exchange rate. Yesterday the price traded right down to this EMA, but couldn’t close below it. Today the pair recovered almost all of the losses which it incurred on Monday, and the bulls definitely have enough reason to be excited about this pair right now.
Don’t forget that the FOMC Meeting Minutes is up tomorrow at 18:00 GMT. This has the potential to generate much market volatility, so be careful when trading close to this time. Besides this, there aren’t any economic data releases worth mentioning. We have a few speeches by some FOMC members tomorrow, but I don’t think we’ll hear anything spectacular from them.
Good luck trading!
- Check out our free forex signals
- Follow the top economic events on FX Leaders economic calendar
- Trade better, discover more Forex Trading Strategies
- Open a FREE Trading Account


