When Moves Like This Screw Up the Charts – One Side of the Coin
To some forex traders, it might seem like trading the GBP pairs has become easier. We know the market sentiment; we know the direction; there´s only one way, down. The poor Pound can´t seem to be able to raise its head, so it must be a child´s play right?
Well, of course not. There´s nothing easy in this game. Whatever the situation or the chart setup, the forex market always requires a lot of sweat and blood otherwise, why would people do other jobs?
We might know the direction the GBP is headed, but we don´t know the support and resistance levels, we don´t know the entry and the exit points. The huge move on Friday morning messed up the forex charts. If you look at the EUR/GBP H1 chart below, there´s nothing to trade technically. There´s a mild resistance level at the current price where we can possibly open a sell position, but going against such a strong trend poses such a high risk, so that´s out of the question. Apart from that, nothing.
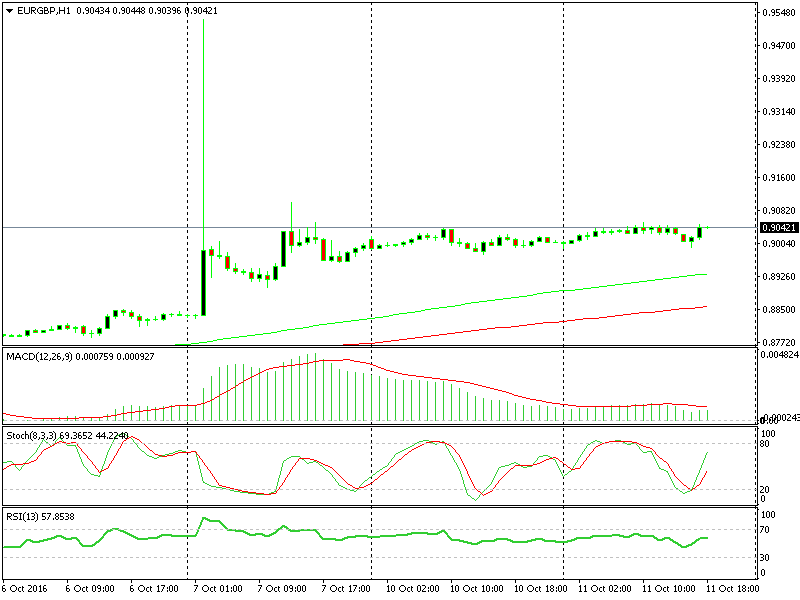
There are no moving averages you could base your trade on, no trend lines, no chart patterns to recognize. Even the two moving averages (100 simple and smooth MAs) that appear on the chart will need a few sessions to catch up with the price. We are already three days past that 700 pip move on the GBP pairs, which means that these pairs remain untradeable for about a week after that event. These moves are like dinosaurs that crush everything they step on.
What do we do on such occasions? We change to smaller timeframe charts. The dinosaur is already history in the smaller timeframe GBP charts. As you can see on the 15 minute EUR/GBP chart below, the large move has disappeared. The dinosaur has been fossilized.
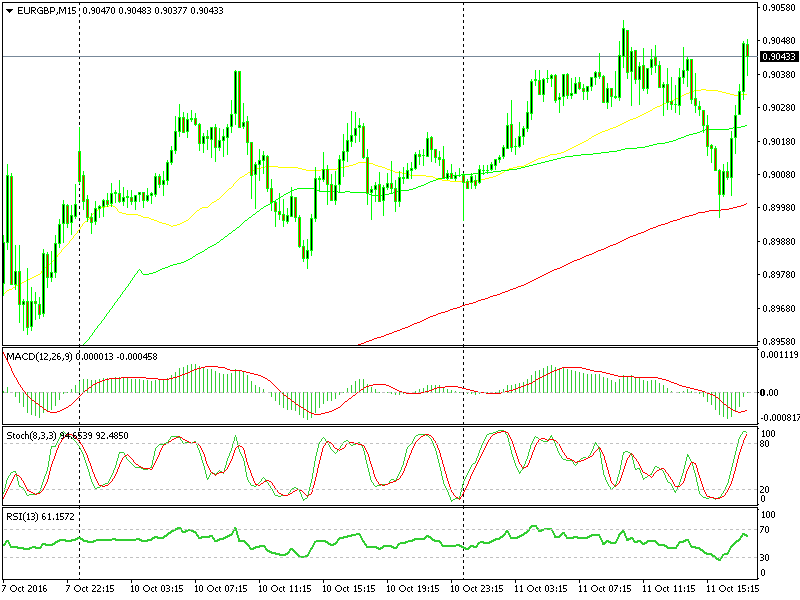
The price here has started to form recognizable chart patterns; we can spot some trend lines and support and resistance levels. Even the moving averages have caught up with the price. Do you see the red moving average? That´s where we opened our latest forex signal… which hit take profit an hour later.
There´s also a mild support level where that moving average stands, which put extra pressure on the sellers to give up when the price was down there. These sorts of timeframes are not very useful for long term trades but you can grab 20-30 pips here and there, until the larger timeframe charts get back to normal technically.
- Check out our free forex signals
- Follow the top economic events on FX Leaders economic calendar
- Trade better, discover more Forex Trading Strategies
- Open a FREE Trading Account