Some More Levels For You Folks … And A Re-Evaluation of Our AUD/USD Signal
After having covered EUR/USD and GBP/USD, we will take a look at two more forex major pairs. USD/JPY has been moving higher relentlessly, so I think it´s about time we had a look at it. The other pair is AUD/USD, since we have an open forex signal there.
USD/JPY – Let´s start with the resistance levels in order to anticipate a possible retrace or reversal spot. The closest possible turning level which has some decent potential is just above where the price is right now. 104.50s is where the 100 smooth moving average (MA) stands in the monthly USD/JPY chart.
This SMA has provided resistance and support a few years ago so it´s worth keeping an eye on. If the price moves above it then the picture turns bullish for the long term, if the price remains below then the bearish bias continues for this pair. Obviously, the 105 round number holds some strength but the next meaningful level is 105.50. That was one of the main numbers when this pair tumbled from above 120, so it doesn´t take a genius to know that this will be an important level again as the price climbs up.
AUD/USD – I don´t know how many of you guys follow our forex signals, but those who do must be interested to know what´s going on with the buy signal we opened in this pair earlier today. It´s about 10 pips in the red right now, but the good news is that the price is moving higher. The reasons for this signal were:
1 – This pair showed resilience during the USD surge this morning. While most major currencies lost a considerable amount of pips against the buck during the night/early morning, the Aussie was about 40 pips higher when we decided to open it. This meant that if the sentiment was to reverse, AUD/USD would be the first forex pair to take advantage of it and gain the most.
2 – The price was sitting just above the 50 SMA on the H1 forex chart, which provided some decent support on Monday.
3 – The stochastic indicator was oversold on the H1 chart
So, these three indicators were pointing up a few hours ago and that´s why we opened a long position in this pair. But just to know what´s in our way, where do the support and resistance levels stand?
The first support level comes at 0.7530-40 which is where the 100 SMA lies on the daily and weekly forex charts which make it a tough nut to crack. The 20 SMA on the monthly chart at 0.7420 is another line worth watching.
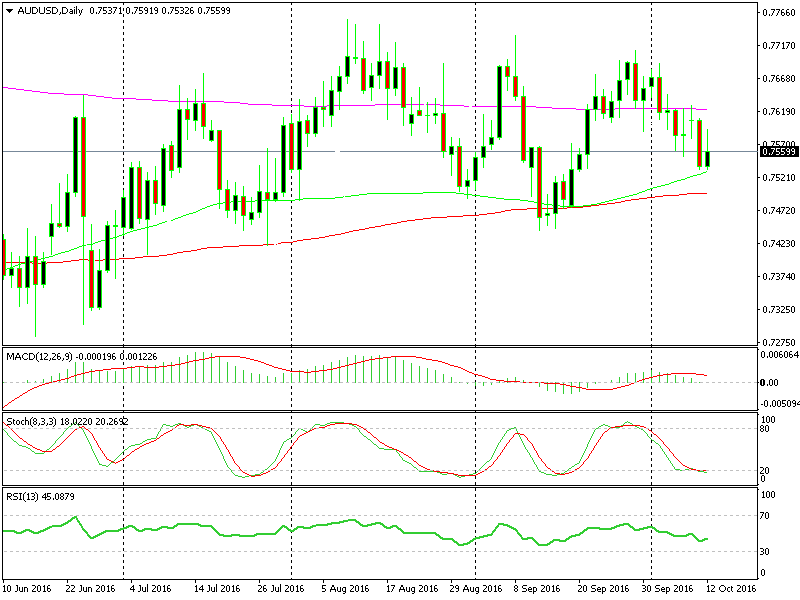
The 100 MA is keeping the uptrend intact
Switching to the H1 chart, the 100 SMA on this timeframe has been a naughty girl today, when it stopped the price from moving higher after we opened the buy signal. That moving average comes at 0.7570s. Today´s high at 0.7590-0.7600 is the second resistance level and the 100 SMA on the H4 chart add extra strength to that.
These are the nearby support and resistance levels for these two forex pairs if you want to trade against them. But, with London closed and a very quiet afternoon so far, I don´t think we can do much more than scalp a few times here and there.
- Check out our free forex signals
- Follow the top economic events on FX Leaders economic calendar
- Trade better, discover more Forex Trading Strategies
- Open a FREE Trading Account
- Read our latest reviews on: Avatrade, Exness, HFM and XM
Related Articles


Sidebar rates
Related Posts
