Super Mario Sinks the Euro, But the Canadian and Australian Currencies were the Biggest Losers on the Day
I like it when volatility hits the FX market like it did today. Although today's market movement is not to be compared to the large moves we saw with the Brexit vote on the 24th of June, and the pound ‘flash crash’ that happened two weeks ago, it still had enough force to generate some great trading opportunities.
The ECB kept their key interest rates unchanged today and left the door open for more easing down the line. First, there was a lot of whipsaw in the EUR/USD – the pair initially bounced about 75 pips. This happened in a very short time, after which the pair gave back all of these gains, plus many more pips. Let’s look at some charts:

EUR/USD Daily Chart
I’m glad the pair broke out of this triangle formation a few days ago. Although the picture is still sideways on the larger timeframes (like weekly and monthly charts), the shorter term picture is very bearish, especially with the recent impulsive decline of the last few days.
At the moment the pair is quite oversold, and it might be problematic to try and chase it lower at this stage. Of course, you could make some money by doing this, but as traders, we should learn the vital discipline of only taking high probability trades. Chasing big moves that are already overextended does not stack the probabilities in your favor. You need to use much wider stops, and it is often difficult to get some decent continued market movement in the desired direction when the price is already oversold or overbought. I would like to see a pullback of at least 50 pips before I’d consider entering short positions again. Perhaps we could get a splendid pinbar candle rejecting off the 20-EMA on a 4-hour chart or something like this. Look at the following chart:
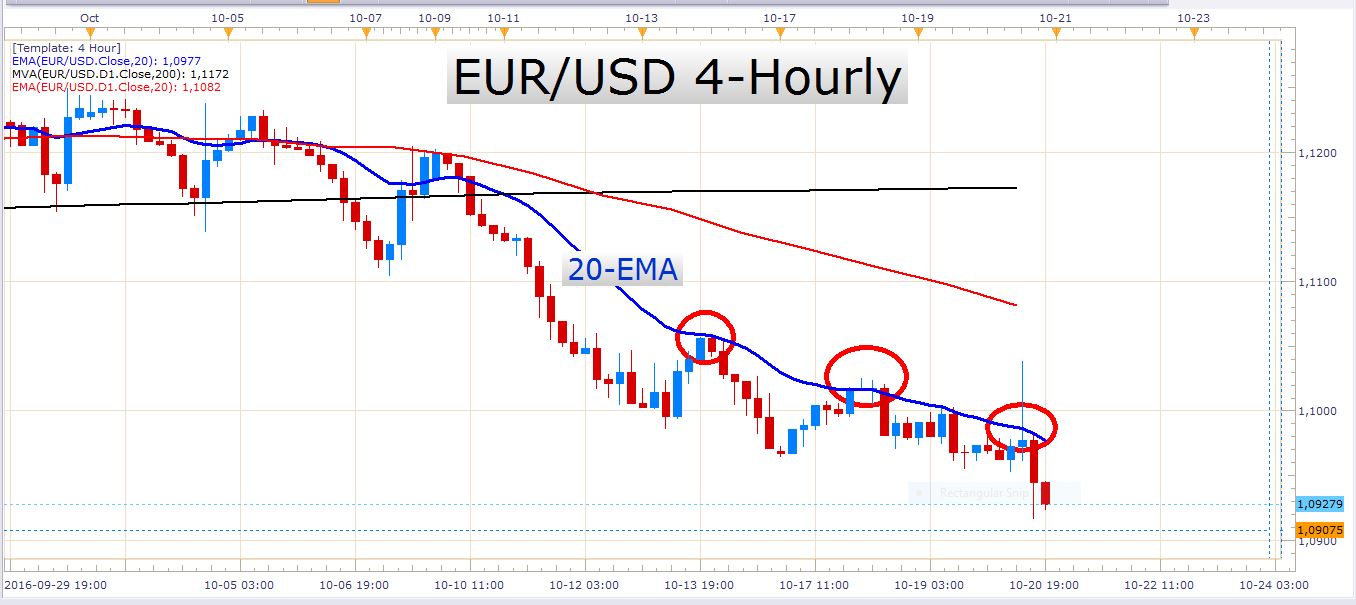
EUR/USD 4-Hour Chart
The red circles mark the recent pullbacks to the 20-EMA. It is easy to see that the price often reacted to this exponential moving average in a favorable manner. There are definitely other ways to trade this pair. For those of you who prefer to trade off larger timeframes, you could always wait for retracements to the 20-EMA on a daily chart, for example. This requires more patience, but trading decisions are made using much more data than on the smaller timeframes. Think about it this way – in one daily candle, you have the combined market data of all the trading sessions of all the major (and minor) financial centers around the world. Many traders and trading coaches out there advocate the use of larger timeframes like daily, weekly, and monthly charts, rather than small timeframes like 4-Hourly, hourly, and 5-minute charts.
When trading the EUR/USD, don’t forget that the European countries have their fair share of problems and economic challenges to deal with. Just to think of one matter that is a definite threat to Europe – the Deutsche Bank and the heavy $14 billion fine they face at the moment.
AUD/USD
This pair has frequently been pushing against triangle resistance over the last few weeks. This type of ascending wedge is normally used by technical traders to anticipate an upward breakout. On Wednesday the price closed firmly above the top of this wedge, and I’m sure that it caught plenty of traders’ attention. Today’s selloff of almost a hundred pips was exactly what these traders didn’t want to see. This brought the exchange rate back into its old familiar range again. Look at the impulsive selling that took place today:
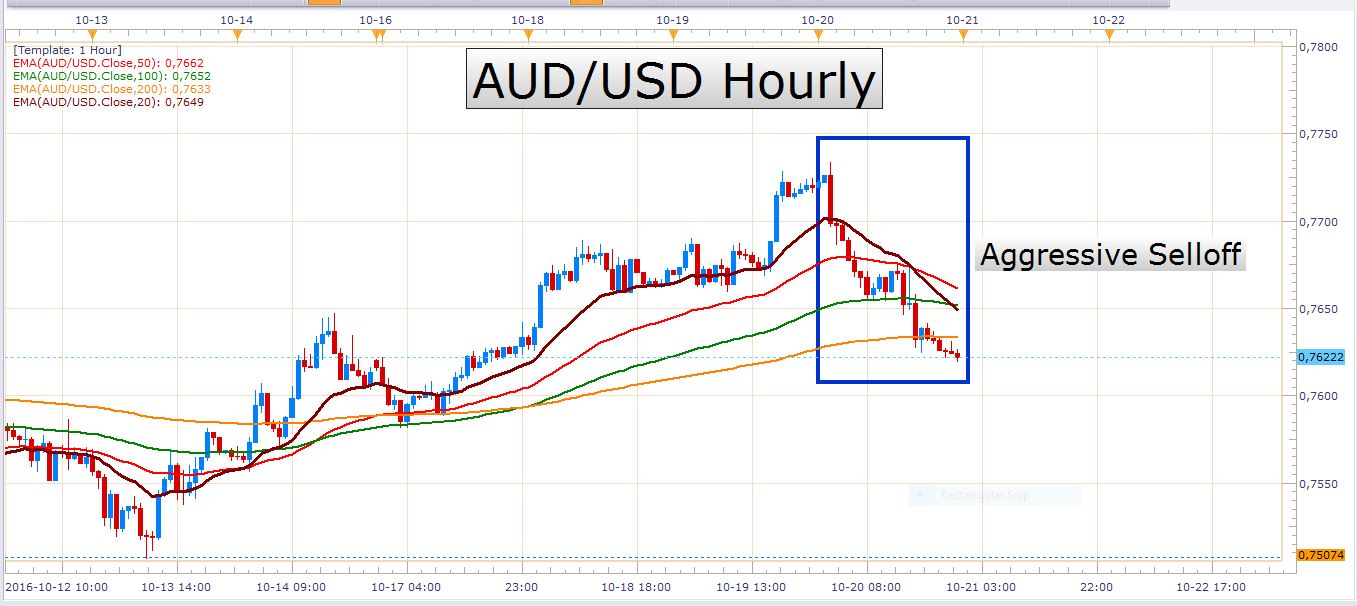
AUD/USD Hourly
Traders who want to play this pair at the moment need to take heed of the sideways range that it currently finds itself in. If you look at this daily chart, you will notice what I mean:
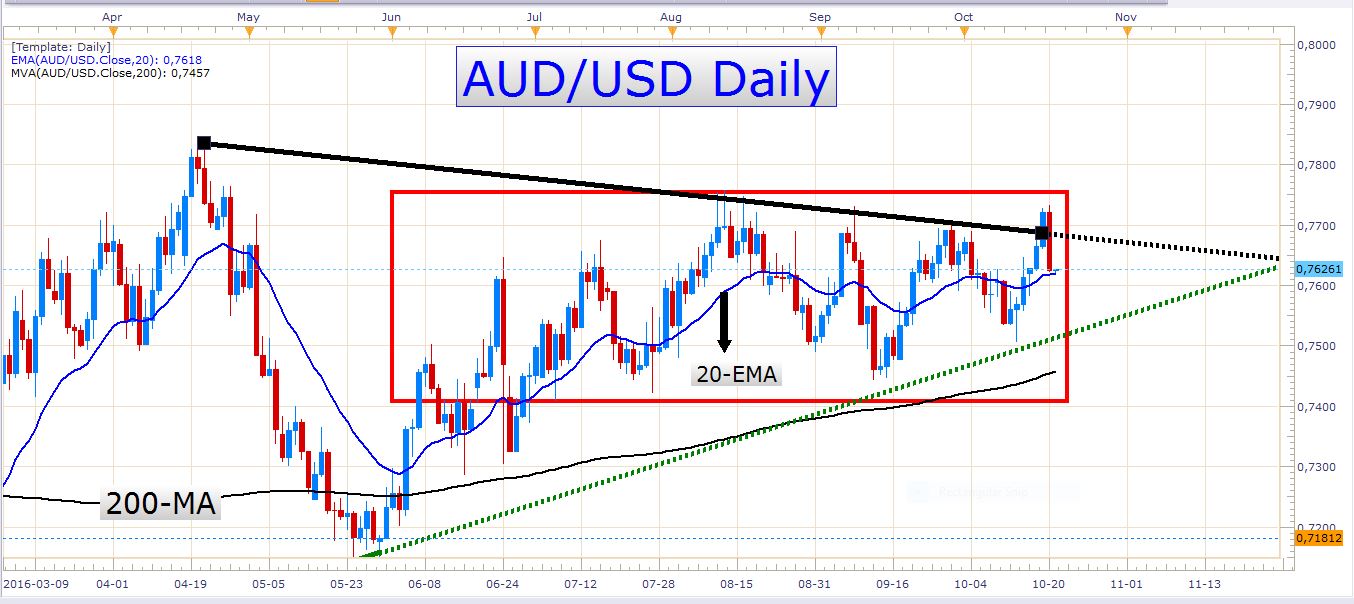
AUD/USD Daily Chart
For the last 98 trading days, the price has been confined to this red box in the chart above. Yes, there have been some decent waves that offered the potential to make a few bucks, but for the trend trader, this type of price action is definitely not something to get excited about.
USD/CAD
USD/CAD Daily Chart
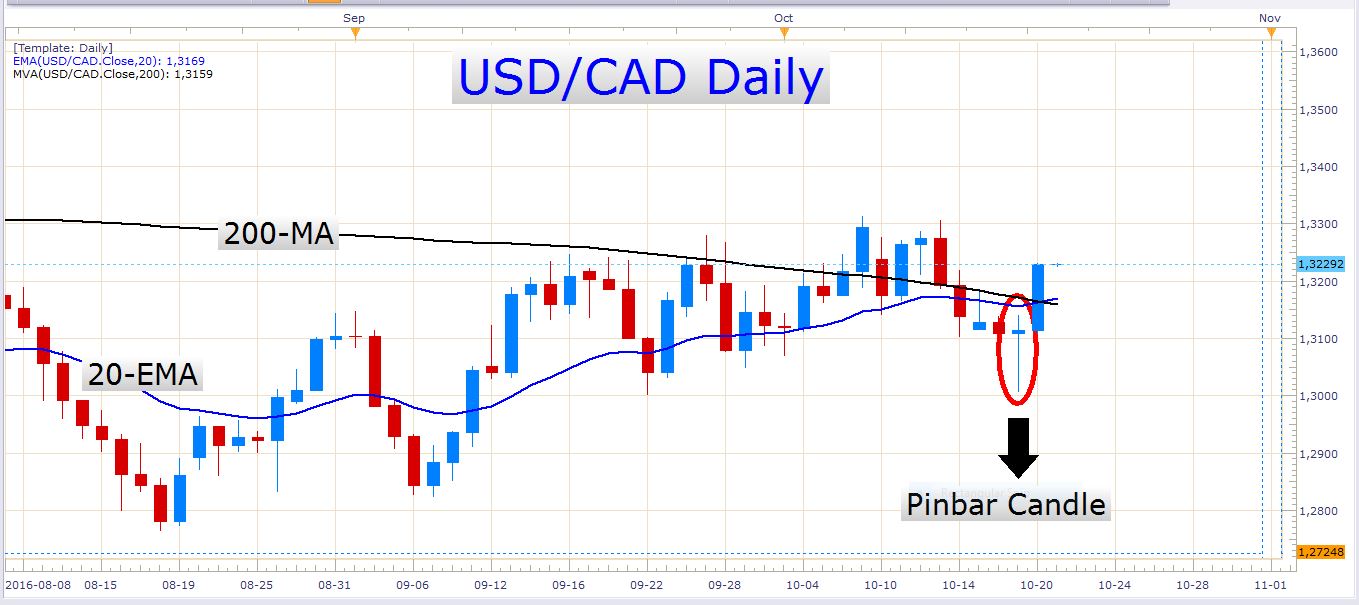
On Wednesday the BOC (Bank of Canada) had their interest rate decision and released their monetary policy report. This caused a strong selloff in the Canadian dollar which caused this pinbar with the long wick. It is not surprising at all that the next candle was a strong bullish candle. This candle closed above the 200-day moving average. The game has definitely changed on this pair, and the way up seems like the path of least resistance at the moment. At the moment it looks like this recent bullish move is very much extended and traders might want to wait for the momentum to slow down a bit before entering long. I would prefer to see some sort of a pullback before I entered long on this pair. Look at how this recent bounce looks like on an hourly chart. What a mighty reversal!
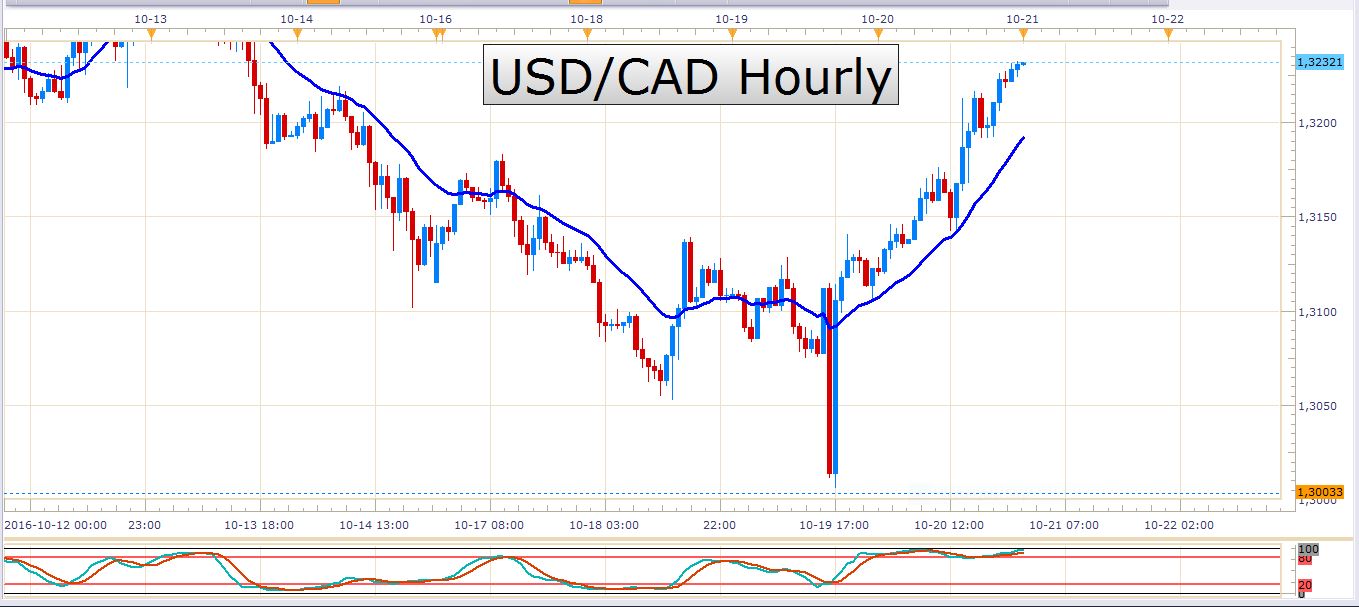
USD/CAD Hourly Chart
News events to watch tomorrow
The Canadians are releasing CPI (consumer price index) data tomorrow, as well as Core Retail Sales numbers. Both of these have the potential to shock the Canadian dollar into action and will be released at 12:30 GMT.
There is an EU leaders summit at 16:00 GMT which could also move the FX market.
Have a profitable day!
- Check out our free forex signals
- Follow the top economic events on FX Leaders economic calendar
- Trade better, discover more Forex Trading Strategies
- Open a FREE Trading Account
- Read our latest reviews on: Avatrade, Exness, HFM and XM
Related Articles


Sidebar rates
Related Posts
