Today the GBP/USD Broke out of its Range – To the Topside!
As expected, the GBP/USD broke out of the narrow range in which it has been trading for about three weeks. Take a look at the following chart:
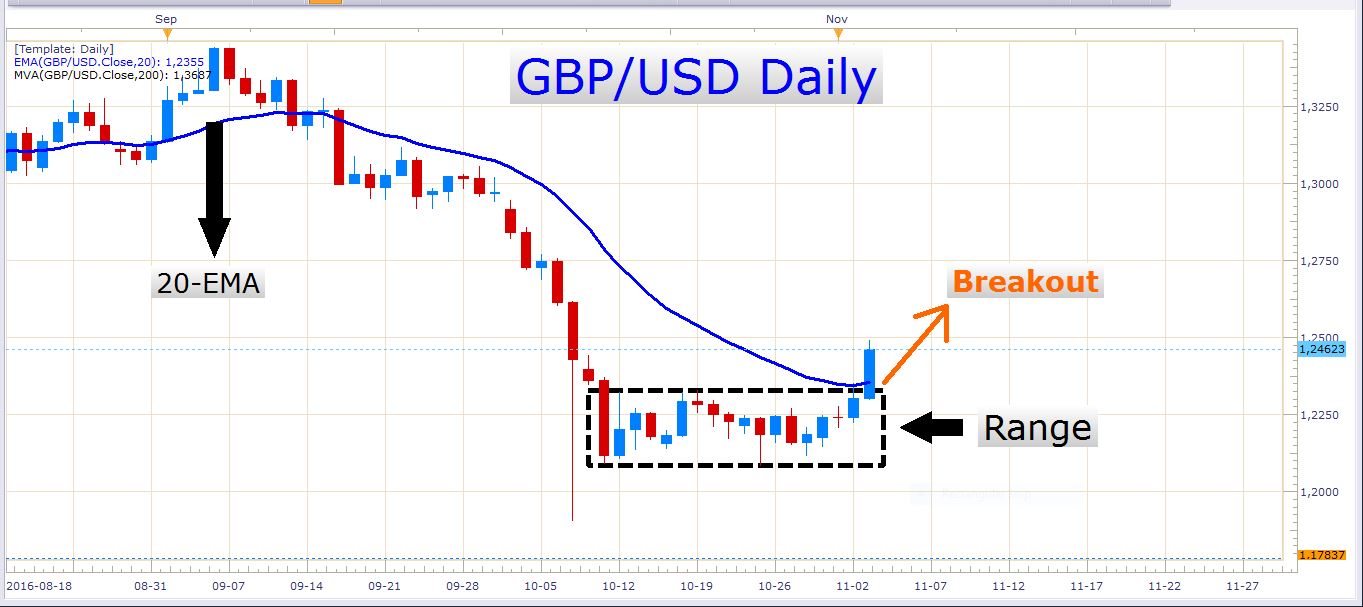
GBP/USD Daily Chart
The BOE (Bank of England) decided to keep their interest rate unchanged today, and the inflation report revealed that a spike in inflation was expected. When was the last time we heard about a risk of overshooting inflation targets? It’s amazing how fast things can change in the economic world.
The Pound Sterling’s recent sharp decline is one of the main factors that raises the BOE’s inflation expectation. The difference between the 2014 high and this year’s low on the GBP/USD is about 5260 pips. Can you believe it! That is a massive decline indeed. The difference between the current exchange rate and the rate just before the Brexit vote is about 2550 pips.
The BOE also increased its economic growth forecast for this year and next year which in itself says a lot about the underlying strength of the UK economy.
Something else that played a role in today’s pound strength, is the news that the UK government can’t trigger Article 50 Brexit negotiations without parliamentary approval. The Supreme Court has set aside time for a hearing on 7-8 December.
To get back to the technicals, let’s look at some more charts:
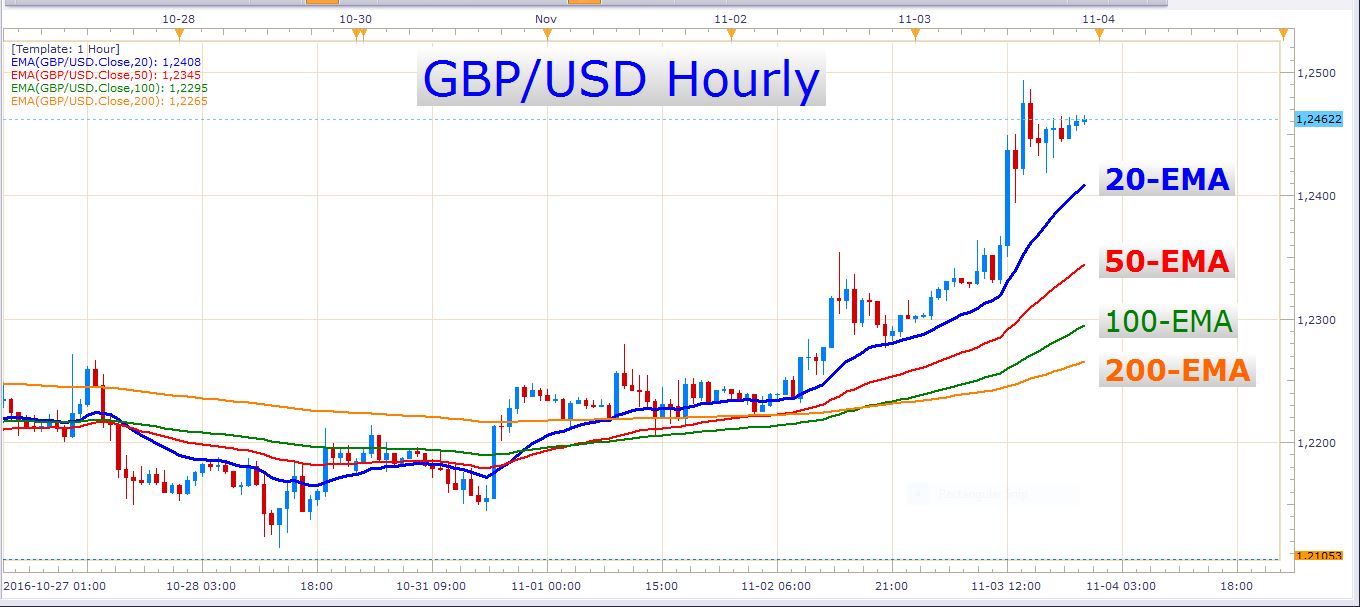
GBP/USD Hourly Chart
Here you can see the aggressive rise in this pair today. You will also notice that the four exponential moving averages are moving further apart from one another, which indicates the presence of strong bullish momentum, and that this move has found some decent acceleration today. You will also notice that the 20-EMA has carried the price all the way up to where it is currently at. There were some good buying opportunities in the vicinity of this exponential moving average today.
I expect some follow through of this bullish momentum tomorrow, and perhaps there could be some really great opportunities to take advantage off.
The long term trend on the GBP/USD is down, but don’t let this blind your eyes from the potential on the ‘long’ side. The first chart I showed you in this article (daily chart) displays how the price ripped through the 20-EMA like a hot knife through butter. Remember that many traders have shorted this pair over the last few weeks and years. Today’s impressive bull run could be the start of a mighty short squeeze which could force many traders to close their short positions that they’ve been holding for quite some time. If this were to happen, it would add some high octane fuel to this bullish bounce. You can be sure that many short stops were already triggered today when the pair broke out of the tight range it traded in.
EUR/USD
This pair has performed remarkably well in the last couple of days. Look at this strong advance:
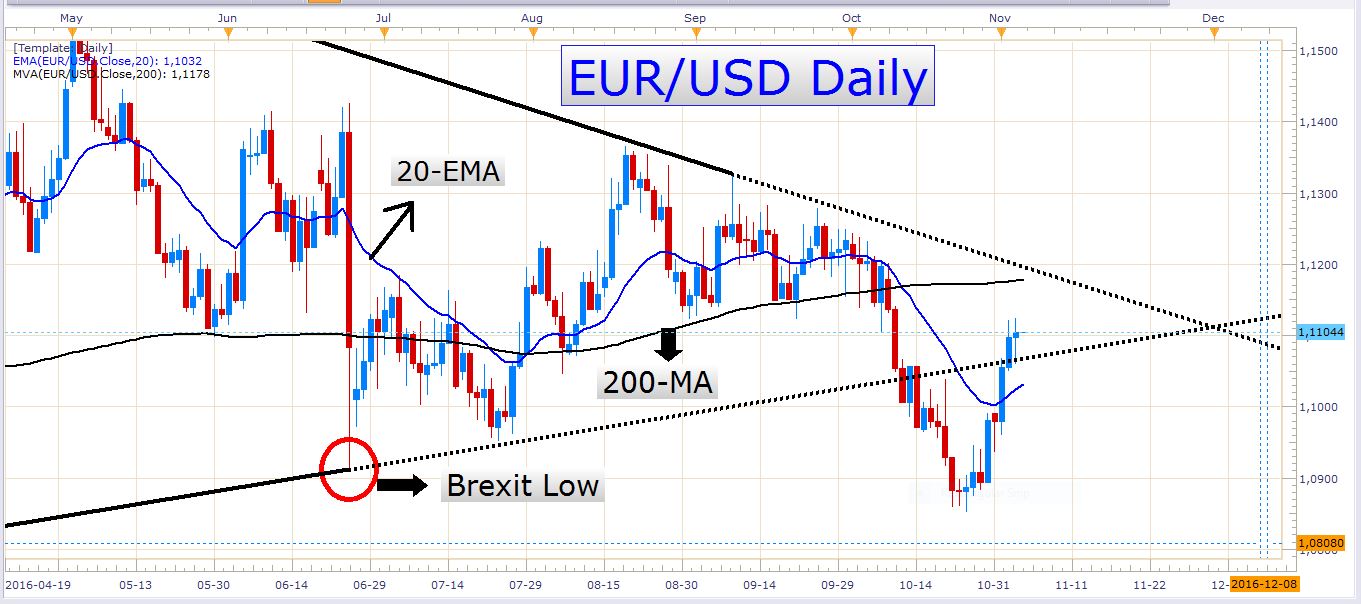
EUR/USD Daily Chart
It is important to consider the very sharp angle at which this pair advanced over these last few days. It looks like this bullish wave might face some exhaustion soon, especially if we consider the technical significance of the zone in which the current price finds itself. Firstly, the price is approaching the 200-day moving average (black moving average) which stands a good chance of resisting the exchange rate. However, there is a more significant element of resistance lying in wait for the bullish market players. Look at the following chart:

EUR/USD Daily Chart
Here you can see that the market price has entered a zone that has formerly proved to be an important level of support (the green box). The green arrows mark the places where the price traded down to the previous support zone. Now we know the saying that says that former support can turn into new resistance. This is where we are now, at a level which could easily be a new resistance zone. Let’s add an indicator the chart, and then look at it again:
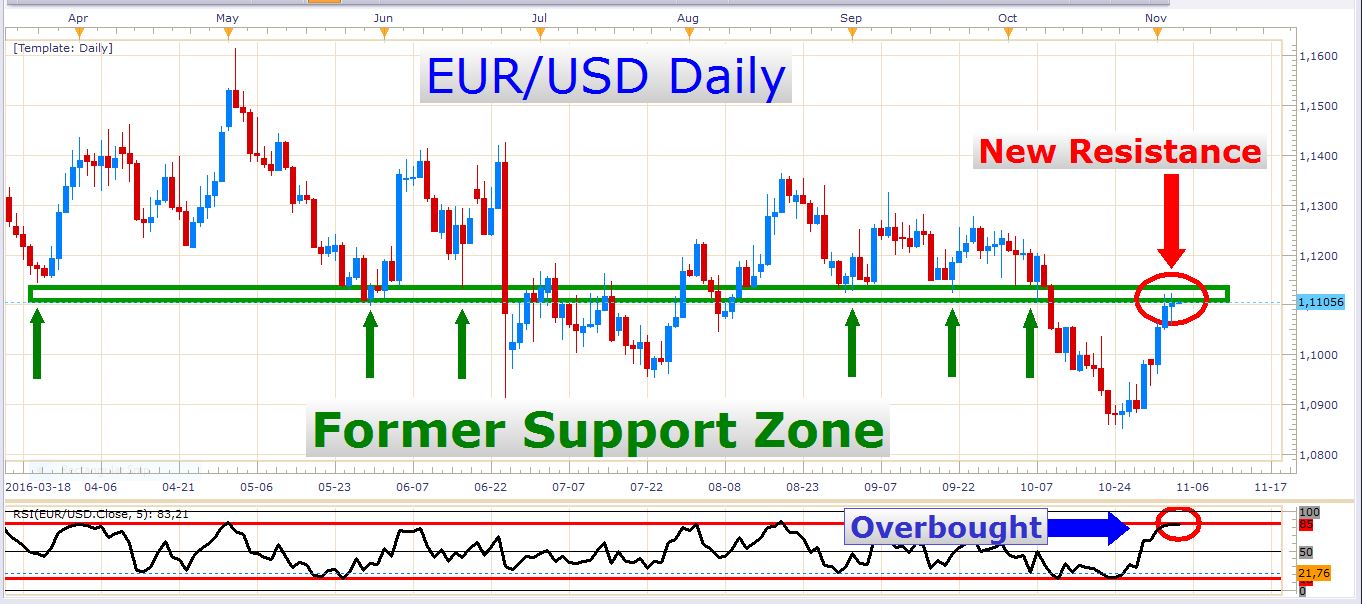
EUR/USD Daily Chart
This is the RSI indicator with a setting of 5 periods and overbought / oversold levels at 85 and 15. Now the indicator is close enough to ‘overbought’ to actually call it overbought for our purpose – we’re only using it as an extra confirmation tool.
There are several ways to play this setup. The first is to enter at the current market price with a stop loss of let’s say 150 pips and a target of 250 to 300 pips. This is the more aggressive option. The other option is to wait for some kind of confirmation that the market is ready to resume lower. Like for instance a pinbar candle or two rejecting off this level, or perhaps a break of the previous daily candle’s low. There are other ways to trade this setup as well, but these two just give you something to think about.
Remember that we have an extremely important event tomorrow with incredible market moving potential – the US nonfarm payrolls numbers at 12:30 GMT. At the same time, there are Canadian employment numbers to be released. Besides these events, there are Australian retail numbers and an RBA monetary policy statement at 00:30 GMT.
The US dollar gave back some more gains in today’s trading. This could change very suddenly if the US nonfarm payrolls numbers come in much better than expected.
Profitable trading!
- Check out our free forex signals
- Follow the top economic events on FX Leaders economic calendar
- Trade better, discover more Forex Trading Strategies
- Open a FREE Trading Account